
Sharpe Ratio vs Sortino Ratio: Which Risk Number Should You Trust in a Crypto Backtest?

Sharpe Ratio vs Sortino Ratio comes down to one question: which volatility counts as risk. The Sharpe Ratio divides return by all volatility, up and down, while the Sortino Ratio counts only the downside. On two real SOL backtests over the same five years, both ratios ranked the run that fell 96.27% at its worst above the run that fell 69.12%.
That is the trap this article is about. Neither ratio measures how deep the worst loss went, so a better reading can sit next to a far deeper Max Drawdown. We compare the two ratios on what they count, how they treat big up moves and how they behave on a one trade buy and hold, using results read on 12 October 2026 and reported without adjustment.
Quick Answer: Sharpe Ratio vs Sortino Ratio
- Sharpe Ratio: return per unit of total volatility. A big up day counts as risk just like a big down day.
- Sortino Ratio: return per unit of downside volatility only. Upside swings are ignored, so it is often higher than the Sharpe Ratio, as it is for both results below.
- Neither one: tells you how far the account fell from its peak. Read either ratio next to Max Drawdown and the trade count.
If a strategy wins rarely but wins big, the Sortino Ratio usually gives the fairer read of its risk. If you want one number that punishes any instability, the Sharpe Ratio is stricter.
What We Compare and How
CoinQuant, an AI trading platform, reports both ratios when it backtests a strategy: the results card on the Performance tab shows the Sharpe Ratio, and the full results returned through CoinQuant's public API include the Sortino Ratio. Both results below were read that way from the author's account on 12 October 2026.
| Criterion | What we check |
|---|---|
| What risk each counts | All volatility or only the downside |
| Big up moves | Whether a large winning stretch lowers the ratio |
| One trade buy and hold | What each ratio means when there is only one decision |
| What Max Drawdown adds | Whether either ratio warns about the deepest fall |
Both runs use the same coin (SOLUSDT, spot, Binance), timeframe (1D), window (2021-08-01 to 2026-08-01), $10,000 of capital, 100% of equity per entry and a 0.1% fee on entry and exit, with no slippage set. Data is Kaiko via CoinQuant. Last checked 12 October 2026.
How Each Ratio Is Built
Both ratios share a numerator: the average return above a risk free rate or a target return. They differ only in the denominator, which is where the definition of risk lives.
| Dimension | Sharpe Ratio | Sortino Ratio |
|---|---|---|
| Numerator | Average return minus a risk free rate | Average return minus a target or risk free rate |
| Denominator | Standard deviation of all returns | Downside deviation: the spread of returns below the target |
| Big up days | Raise the denominator and lower the ratio | Ignored |
| Big down days | Raise the denominator and lower the ratio | Raise the denominator and lower the ratio |
| Fairest for | Strategies with fairly symmetric returns | Strategies with lopsided, upside heavy returns |
In words: the Sharpe Ratio is excess return divided by the standard deviation of returns, and the Sortino Ratio is excess return divided by downside deviation. Both are usually annualised. The comparison below does not depend on the exact risk free rate or annualisation, because both results were computed the same way. For the wider set of definitions, see How to Read a Backtest Report: Every Metric Explained.
Two SOL Results on the Same Window
SOL Linear Regression Cross 1D 2021-2026 buys when the close crosses above its 100 period linear regression line and sells when it crosses back below. SOL Buy and Hold 1D 2021-2026 buys on the first day and holds to the end.
| Metric | Linear Regression Cross | SOL buy and hold |
|---|---|---|
| Strategy | SOL Linear Regression Cross 1D 2021-2026 | SOL Buy and Hold 1D 2021-2026 |
| Sharpe Ratio | 0.58 | 0.64 |
| Sortino Ratio | 0.95 | 0.97 |
| Max Drawdown | 69.12% | 96.27% |
| Total Return | +138.64% | +110.02% |
| CAGR | +18.99% | +15.99% |
| Total Trades | 61 | 1 |
| Win Rate | 27.87% (17W / 44L) | n/a (single hold) |
| Total Fees | $2,717.37 | $31.01 |
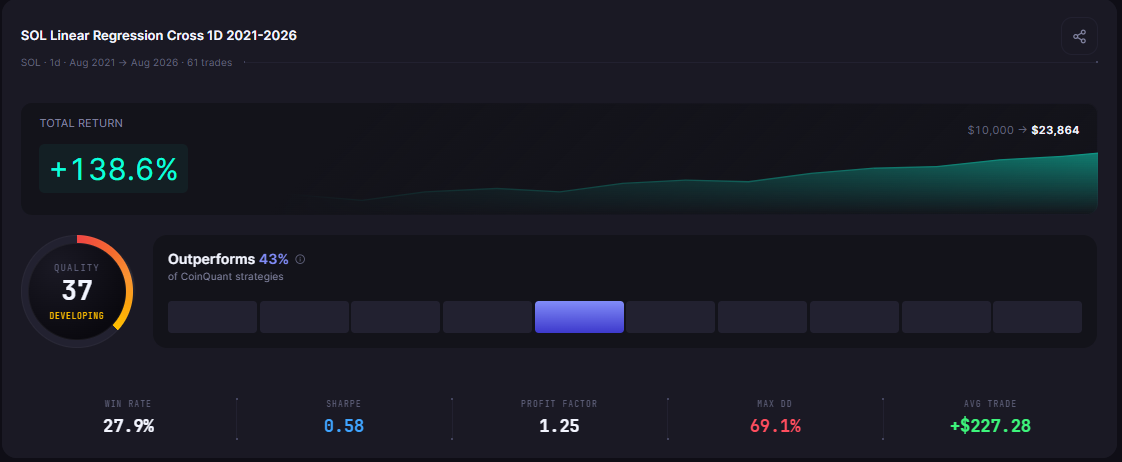
Both runs share the same window, capital, sizing and 0.1% fee, so the rows compare like with like. The strategy finished ahead on Total Return and with a shallower Max Drawdown, yet it scored lower on both ratios.
On the Performance tab, the strategy's results card shows its Sharpe Ratio of 0.58 and its 61 trades. That clears the 50 trade bar, so the card rates it with a Quality score of 37. The Sortino Ratio of 0.95 is not on the card.
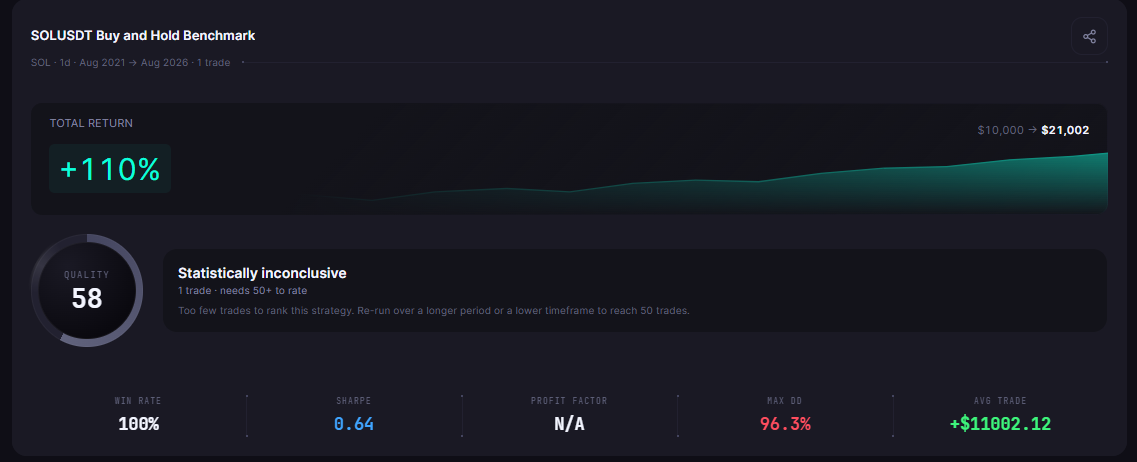
The buy and hold card shows a higher Sharpe Ratio of 0.64 from a single trade. Its results card marks the run "Statistically inconclusive": one trade, and it needs 50+ to rate.
When the Two Ratios Disagree
On these two results the ratios agree on the ranking: buy and hold scores higher on both. Where they differ is the size of the gap. On the Sharpe Ratio the strategy trails by 0.06; on the Sortino Ratio it trails by only 0.02.
The strategy's Sortino Ratio is 1.64 times its Sharpe Ratio, against 1.52 times for buy and hold. That fits a return stream with large upside swings. Its best trade returned 231.20% after fees, and that single trade was bigger than the strategy's whole net profit. The Sharpe Ratio counts a swing like that as risk; the Sortino Ratio does not.
A full flip in ranking can happen when one strategy's volatility is mostly upside and the other's is mostly downside. These two results do not flip, but they show the direction: switching to the Sortino Ratio helps the strategy with the bigger winners.
What both ratios miss is depth. Buy and hold ranks higher on both, yet its Max Drawdown was 96.27% against 69.12%. A ratio averages risk across the whole window, while Max Drawdown records the single worst fall from a peak, the one you would have had to sit through. For how the strategy itself traded, see Linear Regression Strategy Backtest on Solana: What the Trendline Cross Shows.
Which Number to Trust in a Crypto Backtest
Trust neither on its own. Pair either ratio with Max Drawdown and the trade count, the same trio covered in How to Read Backtest Results: Sharpe Ratio, Profit Factor, and Max Drawdown Explained.
| Where the Sharpe Ratio is the better pick | Where the Sortino Ratio is the better pick |
|---|---|
| Comparing strategies whose returns are fairly symmetric | Strategies that win rarely but big, like the 27.87% Win Rate trend rule above |
| When any instability matters, for example before adding leverage | When upside swings should not count as risk |
| When you want the number shown on the results card | When you can read the full results and compare both |
On a one trade buy and hold, both ratios simply describe the coin's own ride over the window, since there is only one decision. That is useful as a benchmark, not as a verdict on skill. With only one trade, the card does not rate it.
- Check the trade count: 61 trades can be rated; one trade cannot.
- Check Max Drawdown: 96.27% means the account lost almost all of its peak value along the way.
- Read both ratios together: a wide gap between Sortino and Sharpe tells you how much of the volatility was upside.
The Practical Lesson
- The Sortino Ratio is kinder to big winners: 0.95 against a Sharpe Ratio of 0.58 for the trend rule.
- Both ratios preferred buy and hold: 0.64 and 0.97, despite a 96.27% Max Drawdown.
- Depth needs its own number: always read Max Drawdown next to either ratio.
In CoinQuant you can backtest any rule on the same coin and window as a buy and hold baseline, then read the ratios, Max Drawdown and trade count together before deciding which result to trust.
Build trading strategies on real data. No coding required.
Frequently Asked Questions
Is the Sortino Ratio better than the Sharpe Ratio for crypto?
Neither is better in general. The Sortino Ratio suits strategies with lopsided, upside heavy returns, while the Sharpe Ratio penalises all volatility. Read either one next to Max Drawdown.
Why is my Sortino Ratio higher than my Sharpe Ratio?
The Sortino Ratio only counts downside volatility, so its denominator is smaller whenever part of the volatility is upside. In the SOL results here it was 0.95 against a Sharpe Ratio of 0.58 for the strategy, and 0.97 against 0.64 for buy and hold.
Which risk ratio should I trust in a crypto backtest?
Trust the combination, not one number. Check the trade count first, then Max Drawdown, then both ratios: in this test both preferred the run with a 96.27% Max Drawdown.
Explore how CoinQuant helps you build, test and compare trading strategies. Explore CoinQuant
Disclaimer:
This content is for educational and informational purposes only and does not constitute financial, investment, or trading advice. All strategies and examples are for illustrative purposes and do not guarantee results. Always conduct your own research before making financial decisions.