
Average Trade vs Median Trade: Which Number Tells You What a Typical Trade Made?
Average trade vs median trade comes down to one question: do you want to know what the strategy made per trade overall, or what a typical trade made? In one real Bitcoin backtest the results card shows an AVG TRADE of +$116.75, yet the median trade lost $124.27. Both numbers are correct; they answer different questions.
The gap comes from a few large winners. The three best of 62 trades made $9,791.60 together, 135.27% of the $7,238.77 net profit, so the other 59 trades lost money as a group.
This page compares the two numbers on what they measure, where to find them in CoinQuant and when to trust each. The author ran the backtest on CoinQuant, read the results on 19 October 2026 and reports them without adjustment.
Quick Answer: Average Trade vs Median Trade
- Average trade (the mean): net profit divided by the number of trades. It tells you what the strategy earned per trade in total, rare big winners included.
- Median trade: the middle trade when every trade is sorted by profit. It tells you what a typical trade looked like.
- Check both: a positive average with a negative median means a handful of trades carry the whole result.
What Average Trade and Median Trade Mean
October gives an everyday example of mean vs median returns in crypto. BIT's Knowledge Hub table puts Bitcoin's October return from 2013 to 2025 at a mean of +19.92% and a median of +14.71%, so the mean is the higher of the two.
BIT puts the difference in two sentences: "The mean tells you what happened in total, including the freak years. The median tells you what a normal year looked like."
Trades work the same way. A backtest's average trade includes every outsized winner, while the median ignores how big the outliers were. CoinQuant, an AI trading platform, shows the average on the results card as AVG TRADE; the median you work out from the trade log.
| Dimension | Average trade (AVG TRADE) | Median trade |
|---|---|---|
| What it measures | Net profit per trade, across all trades | The net result of the middle trade |
| Effect of a few big trades | Pulled strongly toward them | Barely moves |
| Links to the total | Times the trade count, it gives the net profit | No direct link to the total |
| Where to find it in CoinQuant | AVG TRADE in the bottom row of the Performance tab results card | Not on the card: work it out from the Net PnL on the Trades tab exit rows |
| In this example | +$116.75 | -$124.27 |
| Verdict | Use it to judge whether the strategy made money per trade overall | Use it to judge what a typical trade was like |
Example: The Card Says $116.75, the Median Trade Lost $124.27
The example is BTC Klinger 34-55-13 Cross 1D 2021-2026 from the author's strategy library. It buys BTC when the Klinger Volume Oscillator (34, 55, 13) crosses above its signal line while the oscillator is above zero, and sells when it crosses back below the signal line. The test ran on BTCUSDT spot (Binance, Kaiko via CoinQuant) from 2021-08-01 to 2026-08-01 with $10,000, 100% of equity per entry and a 0.1% fee on entry and exit, with no slippage set.
| Metric | Value |
|---|---|
| Strategy | BTC Klinger 34-55-13 Cross 1D 2021-2026 |
| Total Return | 72.39% |
| Final Balance | $17,238.77 |
| Total Trades | 62 (20W / 42L) |
| Win Rate | 32.26% |
| Profit Factor | 1.55 |
| Max Drawdown | 28.23% |
| AVG TRADE (results card) | +$116.75 |
| Median trade (trade log) | -$124.27 |
| Average win / average loss | $1,015.43 / $311.19 |
| Total Fees | $1,757.73 |
The results card on the Performance tab shows 62 trades, so it gives a Quality rating, and its bottom row shows AVG TRADE at +$116.75. That is the net profit of $7,238.77 divided by 62 trades.
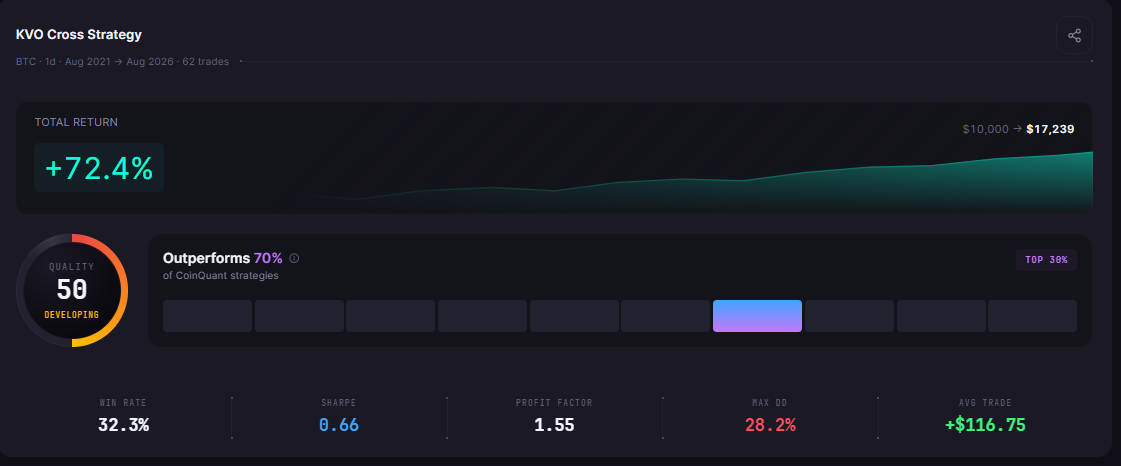
BTC Klinger 34-55-13 Cross 1D 2021-2026 results card: 62 trades, +72.4% Total Return, $10,000 to $17,239, Quality score 50, AVG TRADE +$116.75
The median tells a different story. The figures here are arithmetic on the trade log, after fees: sorted by Net PnL, the 31st and 32nd of the 62 trades are -$128.73 and -$119.82, so the median trade is -$124.27. In percentage terms, the median trade return was -0.90% and the mean trade return +1.14%.
Three trades explain the gap:
| Entry | Exit | Return after fees | Net PnL after fees |
|---|---|---|---|
| 2024-11-06 | 2024-11-24 | +29.32% | +$4,133.62 |
| 2023-01-02 | 2023-01-22 | +35.95% | +$3,084.74 |
| 2023-10-18 | 2023-10-31 | +22.09% | +$2,573.24 |
Together they made $9,791.60, which is 135.27% of the net profit. Without them, the remaining 59 trades lost money as a group.
How to Find the Median in Your Trade Log
The Trades tab holds everything you need. Its Trade Log numbers orders, not trades: each trade is an Entry row and an Exit row, so this run's header counts 124 orders for 62 trades. Times are UTC.
- Open: go to the Trades tab of the backtest you want to check.
- Collect: use only the Exit rows. Each Exit row carries the trade's Net PnL after both fees; Entry rows show "-" in that column. For a long log, the Trade Log's CSV button saves copying the values by hand.
- Sort: in a spreadsheet, order the Exit row values by Net PnL and take the middle value. With an odd number of trades that is one trade; with an even number, average the two middle values (here the 31st and 32nd).
- Compare: set the median next to AVG TRADE on the Performance tab. A large gap means a few trades drive the result.
The log can show amounts without a thousands separator, for example 4133.62 rather than 4,133.62. The biggest winner in this run sits at order rows 77 and 78.

The biggest winner in the BTC Klinger trade log: order rows 77 and 78, an Entry on 6 November 2024 and an Exit on 24 November 2024, both Filled (times UTC)
Which One to Trust, and When
Neither number is wrong. An average pulled up by a few winners still made money; it just depends on catching those winners. Here, missing all three of them would have turned the net profit into a loss.
| Where AVG TRADE helps | Where AVG TRADE misleads |
|---|---|
| Checking whether a strategy made money per trade after fees | Judging what a typical trade will feel like |
| Comparing two strategies with similar trade counts | Strategies with a low Win Rate and rare big winners, like this 32.26% one |
| Estimating total profit from a trade count | Small samples, where one outlier can swing the average |
For this rule, the median says most trades were small losses: 42 of 62 trades lost, with an average loss of $311.19. The average says the strategy still paid off, because the average win of $1,015.43 was more than three times the average loss. Both are true, and a trader needs both to decide whether they can sit through the losing streaks.
To read the rest of the card alongside these two numbers, see how to read backtest results, CAGR vs Total Return and Sharpe Ratio vs Sortino Ratio. For a full Prove It test of a Klinger rule on BTC, see the Klinger Volume Oscillator strategy backtest on Bitcoin.
The Practical Lesson
- AVG TRADE is a total in disguise: +$116.75 here, which is net profit divided by 62 trades.
- The median is the typical trade: -$124.27 here, a small loss.
- Check the share of the best trades: the top three made 135.27% of the net profit.
When you test a strategy in CoinQuant, read AVG TRADE on the Performance tab, then sort the Trades tab exit rows to find the median before you trust the average.
Build trading strategies on real data. No coding required.
Frequently Asked Questions
What is the difference between average trade and median trade?
The average trade is the net profit divided by the number of trades. The median trade is the middle trade when all trades are sorted by profit, so a few big winners pull the average up but barely move the median.
Why is my median trade negative when the backtest is profitable?
Because most trades lost a little while a few won a lot. In the BTC Klinger example, 42 of 62 trades lost and the median trade was -$124.27, but the three best trades made 135.27% of the net profit.
What does AVG TRADE mean on a backtest?
On a CoinQuant results card, AVG TRADE is the net profit divided by the number of trades, after fees. It was +$116.75 for BTC Klinger 34-55-13 Cross 1D 2021-2026.
Find the median trade of your own backtest, not only the average, before you trust the result.
Disclaimer:
This content is for educational and informational purposes only and does not constitute financial, investment, or trading advice. All strategies and examples are for illustrative purposes and do not guarantee results. Always conduct your own research before making financial decisions.