
Total Return vs Return to Drawdown: Which Number Ranks Crypto Strategies Better?

Rank five crypto backtests by Total Return and a Solana trend rule wins at 170.31%, while a Bitcoin Klinger rule sits fourth at 72.39%. Rank the same five by return to drawdown ratio, Total Return divided by Max Drawdown, and the Klinger rule jumps to second: 2.56 against 2.69 for the leader. Its worst fall was 28.23%; the leader's was 63.30%.
Neither number is wrong. Total Return tells you how much a strategy made; the return to drawdown ratio tells you how much it made for each point of pain along the way. This page ranks five existing results both ways, shows where the order changes and lists what each number hides.
The author ran all five backtests on CoinQuant and reports the results without adjustment. Two of the five are Buy and Hold baselines.
Two Ways to Rank a Backtest
Total Return is the change from the starting balance to the final balance, after fees. Max Drawdown is the largest fall from a peak in the balance to a later low, before a new peak. For a closer look at that second number, see how to read Max Drawdown in crypto trading.
The return to drawdown ratio is one division: Total Return divided by Max Drawdown, both in percent. A ratio of 2.00 means the strategy made twice its worst fall. A ratio below 1.00 means its worst fall was bigger than everything it made.
| Dimension | Total Return | Return to drawdown ratio |
|---|---|---|
| What it measures | How much the balance grew, after fees | How much it grew for each point of its worst fall |
| Formula | Final balance divided by starting balance, minus 1 | Total Return (%) divided by Max Drawdown (%) |
| Top pick among the five | SOL EMA 20 Close Cross 1D 2021-2026 (170.31%) | SOL EMA 20 Close Cross 1D 2021-2026 (2.69) |
| Biggest mover | BTC Klinger 34-55-13 Cross 1D 2021-2026 ranks 4th | BTC Klinger 34-55-13 Cross 1D 2021-2026 ranks 2nd |
| Blind spot | Ignores how deep the losses went | Ignores trade count, time in the market and how long the window was |
| Where to find it in CoinQuant | Total Return on the results card | Not shown as a number: divide the card's Total Return by its MAX DD |
| Verdict | Use it to see what a strategy made | Use it to compare strategies that took very different risks |
Total Return and Max Drawdown come from the same five year window, so the ratio is not a yearly figure. For the difference between total and yearly returns, see CAGR vs Total Return.
The Five Inputs, With Buy and Hold Comparison
All five runs use the same window (2021-08-01 to 2026-08-01), daily candles, Binance spot data, $10,000 of starting capital, 100% of equity per entry and a 0.1% fee on entry and on exit. Fees are included and no slippage was modelled.
| Strategy | Total Return | Max Drawdown | Return to drawdown | Trades | Rank by return | Rank by ratio |
|---|---|---|---|---|---|---|
| SOL EMA 20 Close Cross 1D 2021-2026 | 170.31% | 63.30% | 2.69 | 112 | 1 | 1 |
| BTC Klinger 34-55-13 Cross 1D 2021-2026 | 72.39% | 28.23% | 2.56 | 62 | 4 | 2 |
| SOL Buy and Hold 1D 2021-2026 | 110.02% | 96.27% | 1.14 | 1 | 2 | 3 |
| BNB Volume Pressure Index 20 Zero Cross 1D 2021-2026 | 80.36% | 74.77% | 1.07 | 482 | 3 | 4 |
| BTC Buy and Hold 1D 2021-2026 | 57.33% | 76.63% | 0.75 | 1 | 5 | 5 |
The rules, as stored:
- SOL EMA 20 Close Cross 1D 2021-2026: buys SOL when the daily close crosses above its 20 day EMA and sells when it crosses back below.
- BTC Klinger 34-55-13 Cross 1D 2021-2026: buys BTC when the Klinger Volume Oscillator (34, 55, 13) crosses above its signal line while the oscillator is above zero, and sells when it crosses back below the signal line.
- BNB Volume Pressure Index 20 Zero Cross 1D 2021-2026: buys BNB when the Volume Pressure Index (period 20) crosses above zero and sells when it crosses below.
- SOL Buy and Hold 1D 2021-2026 and BTC Buy and Hold 1D 2021-2026: buy on the first day and hold to the end, a single trade each.
The two Buy and Hold runs are single trades, so their results cards show a QUALITY number next to "Statistically inconclusive" (1 trade · needs 50+ to rate). The leader by both measures, the SOL EMA rule, has 112 trades, enough for its card to place its QUALITY score next to the "Outperforms" box.
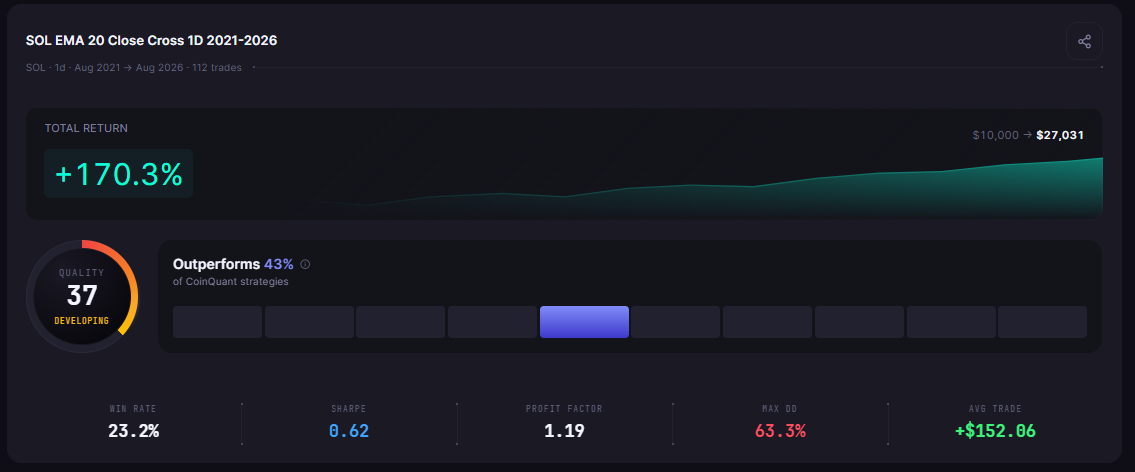
SOL EMA 20 Close Cross 1D 2021-2026: 112 trades, +170.3% Total Return, $10,000 to $27,031, QUALITY 37, with MAX DD on the bottom row
Where the Order Changes and Why
Three of the five change places when you switch measures:
- BTC Klinger 34-55-13 Cross 1D 2021-2026 moves from 4th to 2nd. It made less than three of the others, but its Max Drawdown of 28.23% was by far the smallest, so each point of drawdown bought 2.56 points of return.
- SOL Buy and Hold 1D 2021-2026 moves from 2nd to 3rd. It made 110.02%, but holding SOL meant sitting through a 96.27% fall, which leaves a ratio of 1.14.
- BNB Volume Pressure Index 20 Zero Cross 1D 2021-2026 moves from 3rd to 4th. Its 80.36% came with a 74.77% drawdown, a ratio of 1.07.
The SOL EMA rule stays first and BTC Buy and Hold stays last under both measures. BTC Buy and Hold is the only input below 1.00: its 76.63% drawdown was larger than its 57.33% return.
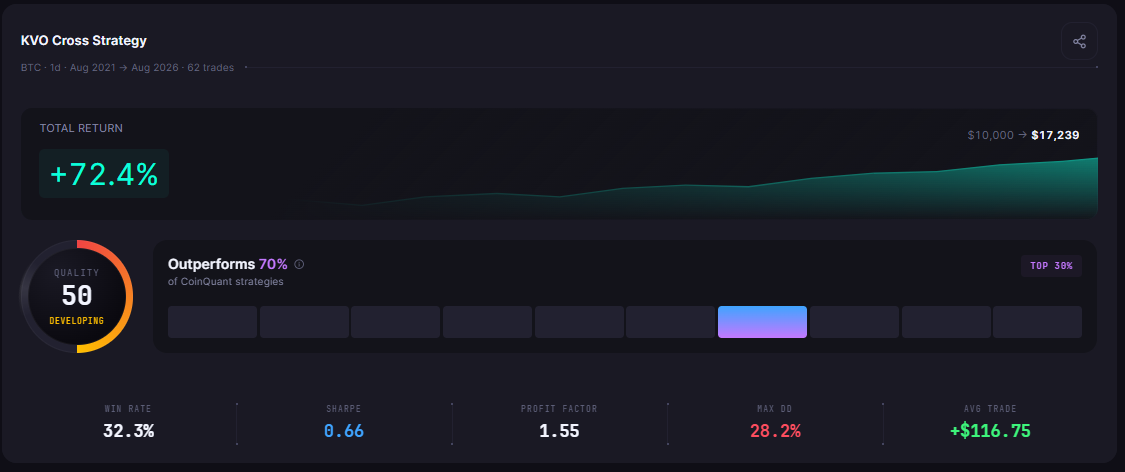
The Klinger rule's results card shows both inputs of its ratio. It shows 62 trades, a Total Return of +72.4% and $10,000 ending at $17,239, with MAX DD on the bottom row. The card header reads KVO Cross Strategy, an internal engine name for the same backtest.
What the Return to Drawdown Ratio Hides
A single ratio is tidy, and that is its weakness. Four things it leaves out:
- Trade count. A Buy and Hold run is one trade, and the ratio treats it like a rule with 112 trades. CoinQuant's card draws the line at 50 trades, which is why both Buy and Hold cards read "Statistically inconclusive".
- Time in the market. The Klinger rule held a position only 14.12% of the time, against 44.39% for the SOL EMA rule and 52.65% for the BNB rule. Less time exposed can mean a shallower drawdown, so part of the Klinger rule's high ratio may come from sitting out.
- One bad stretch. Max Drawdown is set by the single worst fall in five years. A strategy with one deep slump and steady gains elsewhere scores the same as one that bled all the way down.
- Window length. Over a different window, both inputs change. The ratio here is a five year figure, not a yearly one.
The yearly version shows how fragile the order is. CAGR is the steady yearly rate that turns $10,000 into the final balance over the window: 21.99% for the SOL EMA rule and 11.50% for the Klinger rule. Divide each by its Max Drawdown and the Klinger rule moves to first (0.41 against 0.35), because a yearly rate narrows the gap that a large Total Return opens up.
A Simple Rule for Your Own Results
No single number ranks strategies well. Read them in this order:
- Total Return: did the strategy make money, and did it beat Buy and Hold on the same coin?
- Max Drawdown: could you have sat through the worst fall without switching off?
- Return to drawdown ratio: divide the two and compare it across strategies on the same window.
- Trade count: check the card's QUALITY box; under 50 trades it reads "Statistically inconclusive".
- Settings: confirm the same window, fees and sizing before you compare anything.
All five inputs here are long only, one position at a time, no leverage, with fees included and no slippage modelled. For the other risk adjusted measures on a report, see Sharpe Ratio vs Sortino Ratio and how to read a backtest report.
The Practical Lesson
- Total Return picks the biggest winner: SOL EMA at 170.31%.
- The ratio rewards a shallow drawdown: Klinger climbs from 4th to 2nd on a 28.23% Max Drawdown.
- Neither replaces the trade count: two of the five are single trades.
CoinQuant, an AI trading platform, shows Total Return and MAX DD on every results card, so the ratio is one division away. Describe a rule in plain English, run it on the same five years and rank it against these five yourself.
Build trading strategies on real data. No coding required.
Frequently Asked Questions
What is a good return to drawdown ratio?
There is no fixed threshold. Above 1.00 means a strategy made more than its worst fall; among these five, the top two scored 2.69 and 2.56, and BTC Buy and Hold scored 0.75. Compare ratios only across the same window.
Is return to drawdown the same as the Calmar Ratio?
No. The ratio here divides Total Return by Max Drawdown, while a Calmar style ratio divides the yearly return (CAGR) by Max Drawdown. On these five, the yearly version puts the Klinger rule first instead of second.
Should I pick the strategy with the highest return?
Not on that number alone. The highest return here, 170.31%, came with a 63.30% Max Drawdown; check the drawdown, the trade count and the Buy and Hold result before choosing.
Rank your own backtests by both numbers before you choose one.
Disclaimer:
This content is for educational and informational purposes only and does not constitute financial, investment, or trading advice. All strategies and examples are for illustrative purposes and do not guarantee results. Always conduct your own research before making financial decisions.