
CAGR vs Total Return: Which Number to Use When Comparing Crypto Backtests

CAGR vs Total Return comes down to one question: do the backtests cover the same period? Total Return is the whole gain over a test window. CAGR, the compound annual growth rate, is the steady yearly rate that would produce the same end balance, so it is the number to compare when windows differ.
Two real CoinQuant results show why it matters. ETH Rate of Change Cross 1D 2021-2026 made 85.54% over five years, while AI RSI 4H Cross Strategy made 28.06% over about three and a half. Total Return makes the first look about three times better; per year, it grew 13.15% against 7.15%, a little under twice as fast.
This guide explains what each number measures, shows the CAGR formula step by step and covers when Total Return is still the right number to use.
Quick Answer: CAGR vs Total Return Depends on the Window
Use CAGR when backtests cover windows of different lengths, because it puts every result on a per year basis. Use Total Return when the windows are identical, because then both numbers rank strategies the same way and Total Return is the plainer of the two.
What Each Number Measures
- Total Return: the change in the balance over the whole window, as a percentage of the starting capital
- CAGR: the constant yearly growth rate that turns the starting capital into the same final balance over the same number of years
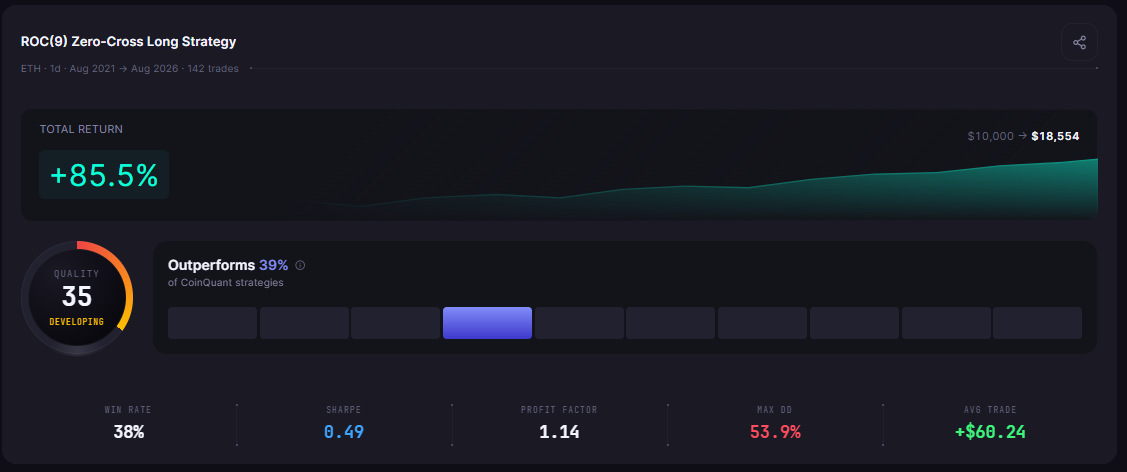
What is CAGR in trading, then? It is the annualized return of a strategy with the bumps smoothed out. In CoinQuant, an AI trading platform, you type a rule in plain English, the platform backtests it on historical data, and the Performance tab results card shows the Total Return and the balance line. The card does not show CAGR, but CoinQuant's backtest results, read here through its public API, report it alongside Total Return.
Buy ETHUSDT on the daily chart when the Rate of Change (period 9) crosses above 0. Sell when it crosses below 0. Test from August 1, 2021 to August 1, 2026 with $10,000, 100% of equity per trade and a 0.1% fee.
That rule is the ETH result used throughout this guide. Its CAGR follows from one formula, written here in plain words: CAGR equals the final balance divided by the starting balance, raised to the power of one divided by the number of years, minus one. The number of years is the days in the window divided by 365, which reproduces the platform's figures.
- Divide the final balance by the starting balance: $18,554.40 ÷ $10,000 = 1.8554
- Count the years: 1,826 days ÷ 365 = 5.0027 years
- Raise 1.8554 to the power of 1 ÷ 5.0027 and subtract one: 13.15% a year
Two Results, Two Windows
The two strategies differ in coin, timeframe and window. ETH Rate of Change Cross 1D 2021-2026 buys ETHUSDT when the Rate of Change (period 9) crosses above 0 and sells when it crosses below. AI RSI 4H Cross Strategy does the same on BTCUSDT 4H candles with RSI (period 14) crossing above and below 50.
| Metric | ROC cross on ETH | RSI cross on BTC |
|---|---|---|
| Strategy | ETH Rate of Change Cross 1D 2021-2026 | AI RSI 4H Cross Strategy |
| Instrument and timeframe | ETHUSDT (spot, Binance), daily | BTCUSDT (spot, Binance), 4 hour |
| Tested window | 2021-08-01 to 2026-08-01 | 2023-01-01 to 2026-08-01 |
| Window length | 1,826 days (5.0027 years) | 1,308 days (3.5836 years) |
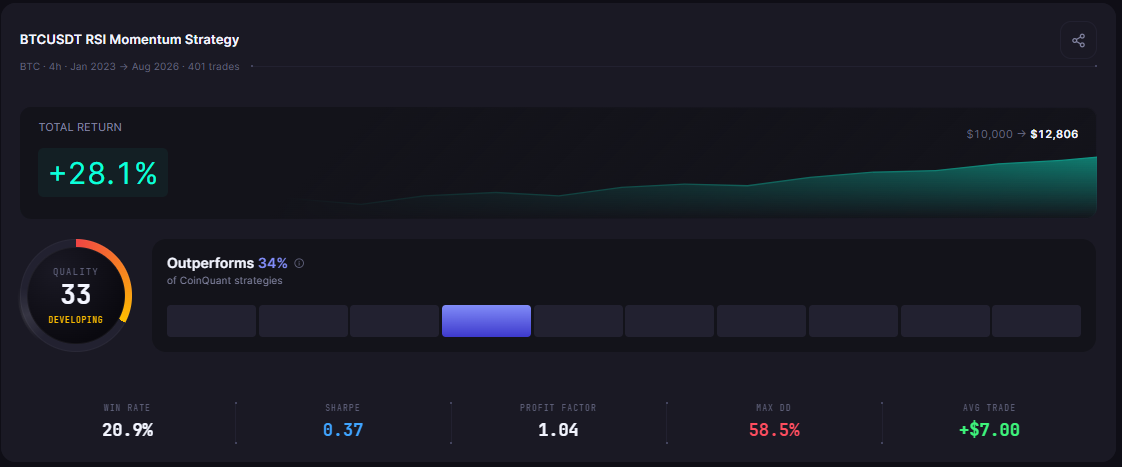
| Total Return | 85.54% | 28.06% |
| Final Balance | $18,554.40 | $12,806.09 |
| CAGR | 13.15% | 7.15% |
| Max Drawdown | 53.93% | 58.45% |
| Total Trades | 142 | 401 |
Both runs used $10,000, 100% of equity per trade and a 0.1% fee on entry and exit, so only the rule, market, timeframe and window differ. The ETH result's Performance tab shows its five year outcome.
The BTC result covers a shorter window, from January 2023 to August 2026, which its Performance tab shows next to the trade count.
Why Total Return Misleads Across Different Windows
A longer window has more time to compound. The ETH test ran 1,826 days and the BTC test 1,308, so part of the ETH result's larger Total Return is simply the extra 518 days.
CAGR removes that advantage by asking what each strategy earned per year. Here the ranking survives, but the gap shrinks from about three times to a little under two. With other pairs, a short test with the smaller Total Return can turn out to have the higher CAGR, and Total Return alone would rank them the wrong way round.
How to Compare Backtests From Different Periods
- Note each test's start and end date
- Count the days in each window and divide by 365
- Calculate CAGR from the final balance, or read it from the results data
- Rank by CAGR, then check Max Drawdown before you decide
When Total Return Is the Right Number
When two backtests share the same window, Total Return and CAGR rank them the same way. The number of years is identical, so a higher Total Return always means a higher CAGR, and the extra step adds nothing.
That is the case for library tests that share the ETH result's 2021-08-01 to 2026-08-01 daily window, capital and fee. Within such a set, the Total Return on each results card is a fair comparison on its own. It is also the number that says what happened to the money: $10,000 became $18,554.40 in the ETH test.
What Neither Number Tells You
Both numbers describe the end point, not the ride. ETH Rate of Change Cross 1D 2021-2026 fell 53.93% from a peak at its worst, and AI RSI 4H Cross Strategy fell 58.45%. A yearly rate of 13.15% says nothing about sitting through a drop of more than half, as how to read backtest results explains.
Neither number adjusts for the market either. The platform's Buy and Hold benchmark carries no fees: over the ETH test window, holding ETH ended at -27.81%, while over the BTC test window, holding BTC ended at 281.07%. The lower CAGR came in a far stronger market for its coin. For what typical results look like, see realistic crypto trading returns from five backtested strategies.
Common Mistakes
| Mistake | What to do instead |
|---|---|
| Ranking tests of different lengths by Total Return | Rank them by CAGR, then check Max Drawdown |
| Annualizing a test of a few weeks or months | Treat CAGR from a short window as noise; a short lucky run compounds to a huge yearly rate |
| Reading CAGR as a steady yearly gain | Remember it is a smoothed rate; the path behind it can include deep falls |
| Assuming CAGR adjusts for the market | It adjusts for time only; compare each result with its own market over the same window |
The Practical Lesson
Match the number to the question: CAGR for different windows, Total Return for the same window.
- Different windows: 85.54% against 28.06% looks like a rout; 13.15% against 7.15% a year is the fair comparison
- Same window: Total Return and CAGR rank strategies identically, so read Total Return
- Always: check Max Drawdown (53.93% and 58.45% here) and the market over the same window
In CoinQuant you can run one rule over several windows, coins or timeframes, then compare the results on a yearly basis with the formula above before you choose. Each change needs its own backtest.
Build trading strategies on real data. No coding required.
Frequently Asked Questions
What is the difference between CAGR and Total Return?
Total Return is the whole gain over the test window. CAGR is the steady yearly rate that gives the same end balance, so it puts tests of different lengths on one scale.
Should I compare backtests by CAGR or Total Return?
Use CAGR when the windows differ in length and Total Return when they are identical. In this guide, 85.54% over five years and 28.06% over about three and a half become 13.15% and 7.15% a year.
Is a higher CAGR always better in a backtest?
No. A higher CAGR can come with a deeper Max Drawdown, fewer trades or a stronger market, and a CAGR from a very short window is mostly noise. Read it next to Max Drawdown and the market over the same window.
Look beyond returns. Explore your strategy’s drawdowns, risk metrics and trade history with CoinQuant. Analyze your strategy
Disclaimer:
Key Takeaway