
Momentum vs Trend Following: Two Rules Tested on the Same Ethereum Data (2021-2026)
The difference between momentum and trend following is easy to blur: both buy when price is rising. Momentum measures how fast price is changing; trend following measures where price sits against a trend line. We tested one simple rule of each kind on Ethereum, a rate of change rule against a moving average rule, with the same window, capital and fees.
The results were far apart. From August 2021 to August 2026, the momentum rule returned 85.54% after fees across 142 trades. The trend rule lost 50.15% across 202 trades, and simply holding ETH lost 27.95%.
The author ran all three backtests on CoinQuant, an AI trading platform. They are reported as they came out. One coin and one window cannot rank the two styles in general, and this article does not try to.
Quick Answer
- Momentum asks: is price higher than it was a set number of bars ago? Here, ROC(9) buys when the change over nine days turns positive.
- Trend following asks: is price above its trend line? Here, a 20-period Hull Moving Average (HMA) cross buys when the close moves above the line.
- On ETH, 2021 to 2026: the ROC rule finished at $18,554.40 from $10,000; the HMA rule at $4,984.92; holding ETH at $7,205.03.
- The catch: both rules lost money on their median trade. Each result depends on a handful of big trades.
The Difference Between Momentum and Trend Following
Momentum compares price with its own past. CoinQuant's Supported Elements page defines the rate of change (ROC) as the percentage change between the current price and the price a set number of bars ago, with a default period of 9 and a zero line. Above zero, price is higher than nine bars ago.
Trend following compares price with a smoothed line. A moving average averages recent closes, and the same CoinQuant page says the HMA "weights recent prices more heavily and applies a smoothing pass, so it turns up or down faster while staying smooth." When the close is above the line, the trend is treated as up.
The two overlap. Time-series momentum, which compares an asset with its own past price, is a close cousin of trend following, and both styles go long when recent prices point up. The practical difference is the trigger: a momentum rule reacts to the speed of the move, while a trend rule reacts to a cross of the line.
How We Compared
Both rules trade ETHUSDT on daily bars, long only, one position at a time, with no stops or targets.
| Parameter | Momentum rule | Trend rule |
|---|---|---|
| Strategy | ETH Rate of Change Cross 1D 2021-2026 | ETH Hull MA Cross 1D 2021-2026 |
| Instrument | ETHUSDT (spot, Binance) | ETHUSDT (spot, Binance) |
| Data source | Kaiko via CoinQuant | Kaiko via CoinQuant |
| Timeframe | Daily (1D) | Daily (1D) |
| Tested window | 2021-08-01 to 2026-08-01 | 2021-08-01 to 2026-08-01 |
| Entry | ROC(9) crosses above 0 | Close crosses above HMA(20) |
| Exit | ROC(9) crosses below 0 | Close crosses below HMA(20) |
| Initial capital | $10,000 | $10,000 |
| Position size | 100% of equity per entry | 100% of equity per entry |
| Fees | 0.1% on entry and 0.1% on exit (no slippage set) | 0.1% on entry and 0.1% on exit (no slippage set) |
| Baseline (same window) | ETH Buy and Hold 1D 2021-2026 | ETH Buy and Hold 1D 2021-2026 |
ROC(9) uses CoinQuant's default ROC period, and the Hull rule uses a 20-period line. We ran each rule once with these settings and did not test other lengths.
Five-Year Results on Ethereum
| Metric | Momentum (ROC) | Trend (HMA) | ETH buy and hold |
|---|---|---|---|
| Strategy | ETH Rate of Change Cross 1D 2021-2026 | ETH Hull MA Cross 1D 2021-2026 | ETH Buy and Hold 1D 2021-2026 |
| Total Return | 85.54% | -50.15% | -27.95% |
| Final Balance | $18,554.40 | $4,984.92 | $7,205.03 |
| Total Trades | 142 | 202 | 1 |
| Win Rate | 38.03% (54W / 88L) | 28.71% (58W / 144L) | n/a (single hold) |
| Profit Factor | 1.14 | 0.89 | n/a (single hold) |
| Sharpe Ratio | 0.49 | -0.08 | 0.26 |
| Max Drawdown | 53.93% | 67.70% | 79.30% |
| CAGR | 13.15% | -12.99% | -6.34% |
| Time in Market | 49.7% | 52.0% | 100.0% |
| Total Fees | $4,427.09 | $3,394.92 | $17.20 |
Both rules spent about half the window in a trade, so the gap is not about exposure. The HMA rule simply traded more often (202 times against 142) and won less often: a 28.71% Win Rate against 38.03%. CAGR here is the steady yearly growth rate that would produce each final balance over five years.
Neither rule won on a typical trade. The median ROC trade lost $131.79 and the median HMA trade lost $156.50. The ROC rule's best trade, from 29 June to 31 July 2025, made $9,149.22 after fees; the HMA rule's best, from 8 to 22 July 2025, made $2,311.96.
On the Performance tab, the momentum rule's results card shows the five-year result with 142 trades, so the card does not mark it "Statistically inconclusive".
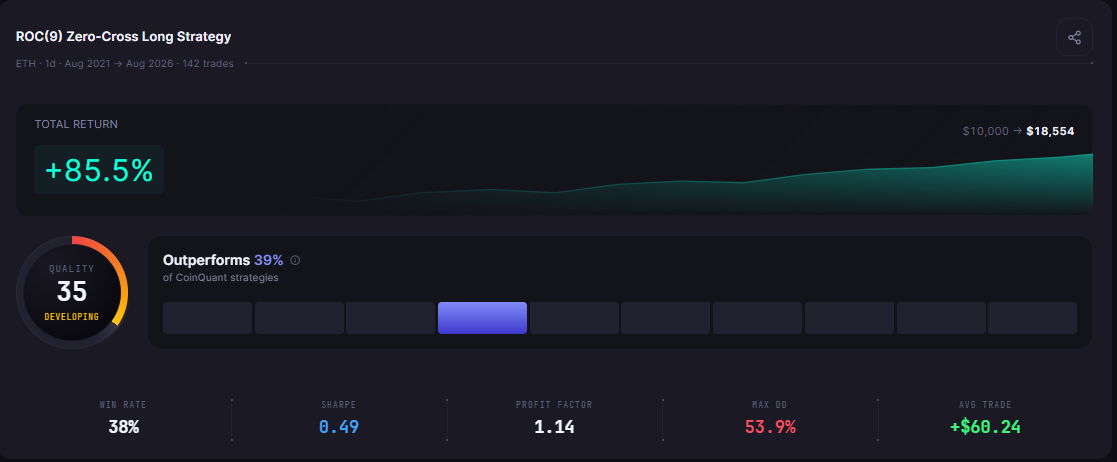
ETH Rate of Change Cross 1D 2021-2026 results card on the CoinQuant Performance tab: daily ETH, Aug 2021 to Aug 2026, 142 trades, +85.5%, $10,000 to $18,554, Quality score 35.
The trend rule is just as plain, which is the point: a rule this short can still trade 202 times in five years when price keeps crossing a fast line. Its Strategy tab shows the whole rule.
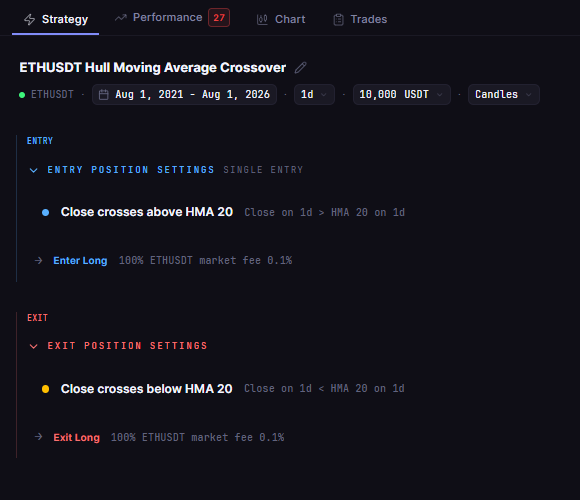
ETH Hull MA Cross 1D 2021-2026 in CoinQuant: enter when the daily close crosses above the 20-period Hull Moving Average, exit when it crosses below, written in plain words.
Buy and Hold Comparison
Holding ETH from August 2021 to August 2026 lost 27.95% after a 0.1% fee on entry and exit, with a 79.30% Max Drawdown along the way. The platform's own Buy and Hold benchmark carries no fees and shows a 27.81% loss, so the table uses the ETH Buy and Hold 1D 2021-2026 strategy, which pays the same fee as the two rules.
Against that baseline, the momentum rule came out ahead and the trend rule came out behind. The HMA rule lost more than holding while in the market only about half the time: its many small losses outweighed its winners, a Profit Factor of 0.89.
Each rule also has its own earlier article built on these same backtests: our ROC strategy backtest on Ethereum and Hull Moving Average backtest on Ethereum.
When Each Style Fits
| Question | Momentum (ROC cross) | Trend following (HMA cross) |
|---|---|---|
| What triggers a trade | The speed of the move turns positive | Price crosses above its trend line |
| Strength, per CoinQuant's docs | "Simple, direct momentum measurement" | "Very low lag vs. SMA and EMA" |
| Limitation, per CoinQuant's docs | "Noisy and prone to false zero-line crosses in chop" | "Can overshoot in choppy, sideways markets" |
| This ETH test (2021 to 2026) | 85.54% over 142 trades | -50.15% over 202 trades |
| Verdict from the CoinQuant backtests | Beat holding ETH here; one test, not proof | Lost more than holding ETH here; one test, not proof |
Neither style wins everywhere, and CoinQuant's Supported Elements page lists choppy markets as a weak spot for both indicators. A trend rule needs trends that last, and ETH ended this window lower than it started, after a 79.30% drawdown. For how trend rules hold up in that kind of market, see our trend following test in a sideways market.
The fair way to choose is to test both styles on the coin and timeframe you actually trade. In CoinQuant you describe each rule in plain English and backtest it on historical data, so you can compare both without writing code.
The Practical Lesson
- Know what each rule measures: momentum reads the speed of price; trend following reads price against a line.
- Expect overlap: both go long in rising markets, so the trigger and the speed decide the difference.
- Check the median trade: both rules lost on a typical trade; a few large winners carried the results.
- Always compare with holding: the ROC rule beat holding ETH here, while the HMA rule did worse.
Run the same pair on BTC or SOL, or test a slower Hull length, before you decide which style suits you.
Build trading strategies on real data. No coding required.
Frequently Asked Questions
What is the difference between momentum and trend following?
Momentum compares price with its own past, for example the change over the last nine days. Trend following compares price with a trend line such as a moving average. Both buy rising markets, but they trigger at different moments.
Is momentum trading better than trend following in crypto?
Not as a rule. In this one Ethereum test from 2021 to 2026, the momentum rule returned 85.54% and the trend rule lost 50.15%. Another coin, window or setting could reverse that, so test both on the market you trade.
Which works better on Ethereum, ROC or a Hull moving average?
In this test, ROC(9) did: 85.54% after fees against -50.15% for the 20-period Hull Moving Average cross, while holding ETH lost 27.95%. Both rules lost money on their median trade, so the result rests on a few big trades.
Compare momentum and trend rules on your own coin before you trade either.
Disclaimer:
This content is for educational and informational purposes only and does not constitute financial, investment, or trading advice. All strategies and examples are for illustrative purposes and do not guarantee results. Always conduct your own research before making financial decisions.