
Rate of Change Strategy Backtest on Ethereum: What ROC Signals Show Across 5 Years

The Rate of Change indicator is the simplest momentum tool there is: today's price divided by the price N bars ago, expressed as a percentage. No smoothing, no moving averages hiding inside it, just one question answered directly: is price higher or lower than it was a fixed number of days back?
The trading logic built on top of it is equally simple. Positive ROC means positive momentum, so hold. Negative ROC means negative momentum, so stand aside. This article tests whether that minimal signal actually produces tradeable entries on Ethereum, with a single mechanical ROC strategy backtested on daily ETH from August 2021 to August 2026, fees included.
The result is one of the more interesting in this backtest series, because the window ends with Ethereum down substantially. The strategy did not.
What the ROC Strategy Actually Does
Rate of Change measures the percentage change between the current close and the close N periods ago. With the platform's default lookback of 9 periods, an ROC reading of +10% means ETH trades 10% higher than it did nine days ago, and a negative reading means the opposite.
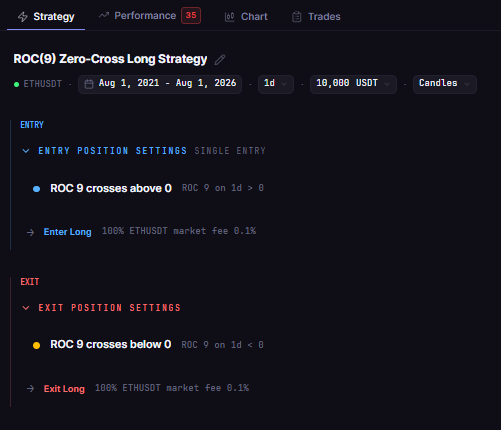
The strategy tested here is the classic zero-line reading of the indicator:
Entry: ROC(9) crosses above zero
Exit: ROC(9) crosses below zero
That is momentum direction expressed as simply as possible: hold Ethereum while its nine-day change is positive, exit when it turns negative. Long only, one position at a time, no leverage, and no additional filters.
Test Setup
| Parameter | Setting |
|---|---|
| Strategy | ETH Rate of Change Cross 1D 2021-2026 |
| Instrument | ETHUSDT (spot, Binance) |
| Timeframe | Daily (1D) |
| Tested window | 2021-08-01 to 2026-08-01 |
| Entry | ROC(9) crosses above zero |
| Exit | ROC(9) crosses below zero |
| Direction | Long only, no leverage |
| Initial capital | $10,000 |
| Position size | 100% of equity per entry |
| Fees | 0.1% taker, modeled |
| Data source | Kaiko via CoinQuant |
| Baseline | ETH Buy and Hold 1D 2021-2026 (same window) |
The Backtest Results
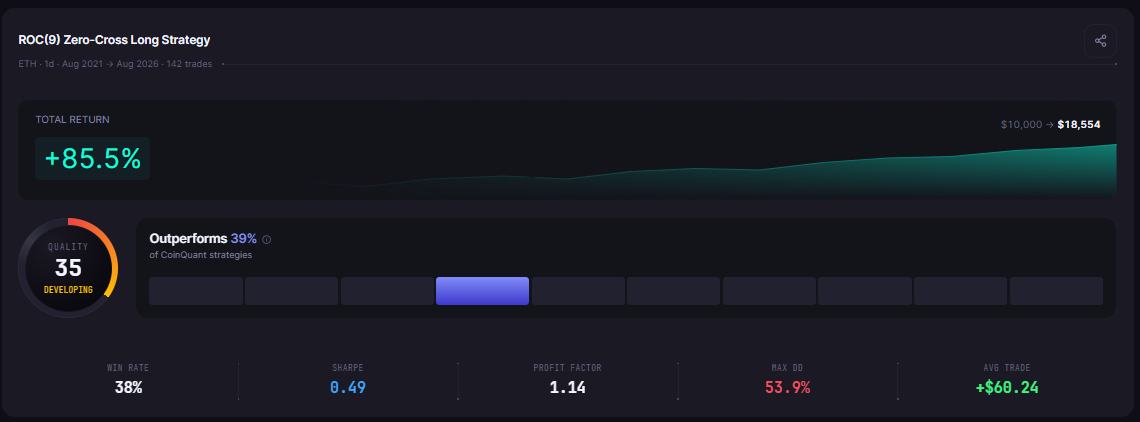
Over the five-year window, the strategy turned $10,000 into $18,554.40, a +85.54% total return from 142 trades, while Ethereum itself lost 27.95% over the same period.
| Metric | ROC Cross | Buy and Hold |
|---|---|---|
| Total Return | +85.54% | -27.95% |
| Final Balance | $18,554.40 | $7,205.03 |
| Total Trades | 142 | 1 |
| Win Rate | 38.0% (54W / 88L) | n/a (single hold) |
| Profit Factor | 1.14 | n/a |
| Sharpe Ratio | 0.49 | 0.26 |
| Sortino Ratio | 0.78 | 0.37 |
| Max Drawdown | 53.93% | 79.30% |
| Average Win | $1,255.04 | n/a |
| Average Loss | $672.93 | n/a |
| Best Trade | +$9,149.22 | n/a |
| Worst Trade | -$2,936.94 | n/a |
| Time in Market | 49.70% | 100% |
| Total Fees | $4,427.09 | $17.20 |
| CAGR | 13.15% | -6.34% |
What the Data Shows
The headline is the gap between the two rows. Holding Ethereum through the window ended at $7,205.03; the ROC strategy ended at $18,554.40. Staying in cash whenever momentum was negative was worth roughly 113 percentage points of difference over five years.
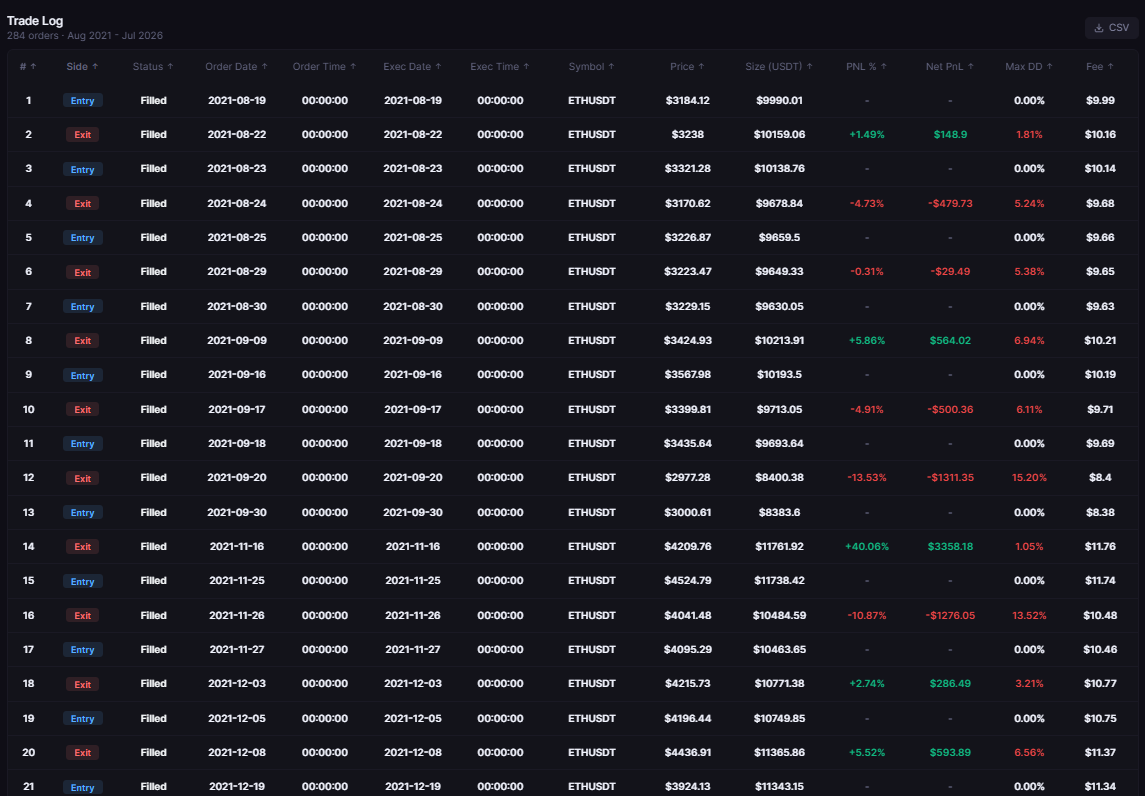
The second finding is the cost of that result. The strategy paid $4,427.09 in fees across 142 trades, which is roughly half of the $8,554 in net profit the account finished with. Averaged across the trades, each of the 142 round trips carried about $31 in commissions before it had made or lost anything.
The third finding is how lumpy the path was. The average win of $1,255.04 against an average loss of $672.93 produces a payoff ratio of 1.87, and the best single trade, held from late June to late July 2025, added +$9,149.22 by itself. The year-by-year ledger shows where the money came from: +$3,687.68 in 2023 and +$8,355.03 in 2024 carried the result, while 2025 (-$1,830.31) and 2026 through August (-$2,092.46) gave a meaningful chunk back.
The 2024 Question
One year produced almost half the strategy's profits: 2024, at +$8,355.03 across 27 trades. Ethereum trended persistently that year, and a momentum rule with a nine-day memory is designed to sit through exactly that kind of year.
That cuts both ways, and the honest read is to treat it as a dependency rather than a feature. A strategy that earns its return in one or two trend years is a different proposition from one that grinds out an edge every quarter. The 2025 and 2026 segments, both negative, are the reminder: when Ethereum chops, a fast momentum flip pays the fee line repeatedly and gets nothing back.
The drawdown profile adds the same note. 53.93% is a large maximum drawdown on its own terms, and it is much better than holding ETH's 79.30%. But a 54% drawdown is the kind of number that forces real decisions, especially with a 38% win rate. Most of the 88 losses are small; the pain arrives in clusters, and the longest losing streak ran eight trades.
The Practical Lesson
The raw ROC(9) zero-line cross returned +85.54% on daily ETH over five years while Ethereum lost 27.95%, so a simple momentum read did produce tradeable entries
The cost was real: 142 trades, $4,427.09 in fees, and a 38.0% win rate carried by a 1.87 payoff ratio
The return concentrated in trend years: +$8,355.03 in 2024 alone, with 2025 and 2026 both negative
The maximum drawdown of 53.93% still requires a strong stomach, even though it is far better than holding through 79.30%
The ROC question now has a documented answer for this window: the signal works on Ethereum, with the same caveat that applies to every fast momentum rule, which is that costs and choppy years decide the final score. The natural next tests are the documented mitigations, such as adding a trend filter like the 100-period moving average above the signal, or requiring ROC to clear a meaningful threshold rather than merely crossing zero. Each variant needs its own backtest.
Run this ROC backtest yourself and test your own momentum settings on CoinQuant. Backtest momentum strategies free on CoinQuant
BACKTEST VERIFIED: Article 264 Strategies (both ETHUSDT 1D, 2021-08-01 to 2026-08-01): ETH Rate of Change Cross 1D 2021-2026 (strategy_version_id a7ba4a07-1cd4-49d5-bb77-46d29b282361, backtest_id 10ed695e-d2c0-4746-a35d-1d2ea93ff5ce, TR +85.54%, 142 trades, 38.0% win, PF 1.14, Sharpe 0.49, DD 53.93%, fees $4,427.09, final $18,554.40); ETH Buy and Hold 1D 2021-2026 (strategy_version_id 8c4f8497-5b51-4812-bd98-49982a6adde2, backtest_id 36856864-3351-453f-a8fe-1eff9549474d, TR -27.95%, 1 trade, DD 79.30%, final $7,205.03). All metrics confirmed via GET /v1/backtests/{id}/results on 2026-09-16.
Disclaimer:
Key Takeaway
