
Holding Bitcoin or Ethereum? Five Years of Returns and Drawdowns Compared (2021-2026)

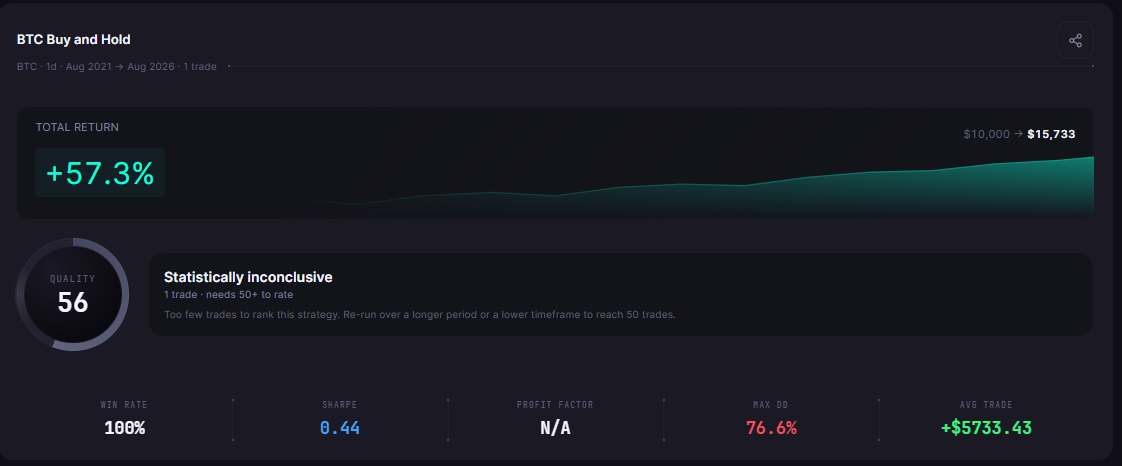
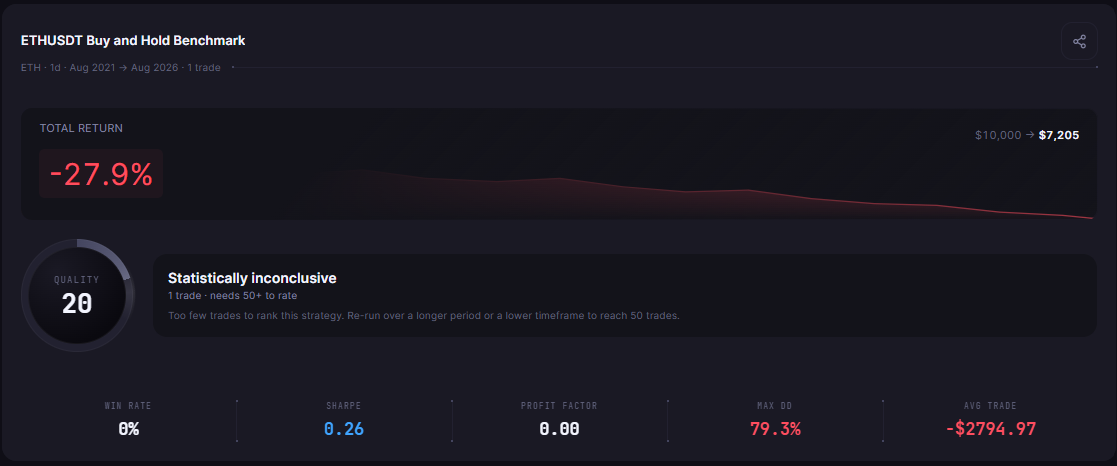
If you searched for "Bitcoin vs Ethereum 5 year performance", the answer for August 2021 to August 2026 is clear: holding Bitcoin turned $10,000 into $15,733.43 (57.33%), while holding Ether over the same five years turned it into $7,205.03 (-27.95%). Both results come from buy and hold backtests the author ran on CoinQuant, fees included.
Bitcoin did not get there smoothly. Its worst fall along the way was 76.63%, and Ether's was deeper still at 79.30%, so both holders sat through losses of more than three quarters of their peak value.
This article sets the criteria first, then shows both records side by side and says plainly where each coin did better. The results are reported without adjustment.
What We Compare and How
Four numbers decide the comparison, chosen before looking at the results:
- Total Return: what $10,000 became by the end of the window.
- Max Drawdown: the deepest fall from a peak to a later low, the part a holder has to sit through.
- Sharpe Ratio: return per unit of overall price swing.
- Final balance: the same as Total Return, in dollars.
Both runs use the same venue, window, capital and fee, so the only difference is the coin.
| Parameter | Bitcoin | Ether |
|---|---|---|
| Strategy | BTC Buy and Hold 1D 2021-2026 | ETH Buy and Hold 1D 2021-2026 |
| Instrument | BTCUSDT (spot, Binance) | ETHUSDT (spot, Binance) |
| Data source | Kaiko via CoinQuant | Kaiko via CoinQuant |
| Window | 2021-08-01 to 2026-08-01 | 2021-08-01 to 2026-08-01 |
| Rule | Buy on the first daily bar, hold to the end | Buy on the first daily bar, hold to the end |
| Capital and size | $10,000, 100% of equity | $10,000, 100% of equity |
| Fees | 0.1% on entry and on exit | 0.1% on entry and on exit |
| Slippage | None modelled | None modelled |
The two rules are stored differently but act the same way. The Bitcoin record enters when the daily close is greater than 0, which is true on the first bar. The Ether record uses a trigger that fires every bar but can open only one position, so it also buys once on the first bar and holds.
Bitcoin vs Ethereum 5 Year Performance Side by Side
Here are the two records on the platform's own figures. CoinQuant, an AI trading platform, reports the same metrics for both, so the rows line up directly.
| Metric | Bitcoin | Ether |
|---|---|---|
| Strategy | BTC Buy and Hold 1D 2021-2026 | ETH Buy and Hold 1D 2021-2026 |
| Total Return | 57.33% | -27.95% |
| Final Balance | $15,733.43 | $7,205.03 |
| Total Trades | 1 | 1 |
| Win Rate and Profit Factor | n/a (single hold) | n/a (single hold) |
| Max Drawdown | 76.63% | 79.30% |
| Sharpe Ratio | 0.44 | 0.26 |
| Sortino Ratio | 0.63 | 0.37 |
| CAGR | 9.48% | -6.34% |
| Total Fees | $25.74 | $17.20 |
| Verdict in this CoinQuant test | Higher return, slightly shallower worst fall | Lost money over the window, with the deeper fall |
Both runs share the same window, capital, sizing and fee, so the rows compare like with like. CAGR is the steady yearly rate that would turn $10,000 into the final balance over the five years: 9.48% a year for Bitcoin and -6.34% for Ether, as the platform reports them.
The platform's own Buy and Hold benchmark carries no fees and ends at 57.65% for Bitcoin and -27.81% for Ether. The table uses the library strategies instead, which pay the 0.1% fee on entry and on exit.
Each record is one trade, so each card shows its QUALITY number next to "Statistically inconclusive" (1 trade · needs 50+ to rate): 56 for Bitcoin and 20 for Ether. That label fits a single hold, which describes a period rather than rating a strategy. The Bitcoin card is below.
Where Each One Fell Hardest
Both worst falls started on the same day. On Binance BTCUSDT and ETHUSDT daily closes (UTC), Bitcoin peaked at 67,525.83 on 8 November 2021 and bottomed at 15,781.29 on 21 November 2022, a fall of 76.63%. Ether peaked at 4,807.98 on the same 8 November 2021 and bottomed at 995.13 on 18 June 2022, a fall of 79.30%.
The two backtests report the same Max Drawdown figures, with the same peak and trough dates in their results, because each record held its coin the whole time. Each recovery date in the table below is the first Binance daily close (UTC, BTCUSDT or ETHUSDT) above that coin's November 2021 peak close: 68,245.71 for Bitcoin on 4 March 2024 and 4,832.07 for Ether on 22 August 2025.
| Worst fall (daily closes, UTC) | Bitcoin | Ether |
|---|---|---|
| Peak close | 67,525.83 on 2021-11-08 | 4,807.98 on 2021-11-08 |
| Lowest close after it | 15,781.29 on 2022-11-21 | 995.13 on 2022-06-18 |
| Peak to low | 378 days | 222 days |
| First close back above the peak | 2024-03-04 (847 days after the peak) | 2025-08-22 (1,383 days after the peak) |
Ether hit bottom about five months sooner, but it took far longer to win back its old high. Bitcoin's price first closed above its November 2021 peak in March 2024. Ether's did so only in August 2025, and then fell back: its close of 1,844.94 at the end of the window on 1 August 2026 was below the run's entry price of 2,555.51.
That is why the Ether card ends at a loss. For how to read this kind of figure, see how to read Max Drawdown.
October 2026, as a Dated Aside
The test ends on 1 August 2026, so the following is context only. On Binance BTCUSDT and ETHUSDT monthly candles (open to close, UTC), October 2026 was the weakest of ten Octobers since 2017 for both coins.
- Bitcoin: from 83,623.59 to 77,582.02, a fall of 7.22%.
- Ether: from 2,686.01 to 2,255.66, a fall of 16.02%.
Ether fell more than twice as far in that month too. One month says nothing about any later month, and none of it is in the backtests above.
What the Gap Does and Does Not Tell You
The gap between 57.33% and -27.95% is real for this window, but it is narrow evidence:
- One start date: both runs bought on 1 August 2021, three months before both peaks. A different start date gives a different answer.
- No mix: neither run holds a blend of the two coins or rebalances.
- No rules: these are holdings, not trading strategies.
For the same trading rule run on both coins, see BTC vs ETH: which asset backtests better with the same strategy. For rules against holding in general, see active trading vs buy and hold in crypto.
Where Each Side Is Better
Against the four criteria set at the start, the result is one sided for this window.
| Criterion | Bitcoin | Ether | Better here |
|---|---|---|---|
| Total Return | 57.33% | -27.95% | Bitcoin |
| Max Drawdown | 76.63% | 79.30% | Bitcoin, by a small margin |
| Sharpe Ratio | 0.44 | 0.26 | Bitcoin |
| Final Balance | $15,733.43 | $7,205.03 | Bitcoin |
| Time from peak to low | 378 days | 222 days | Ether reached its low sooner |
Ether did not beat Bitcoin on any of the four criteria. The one place it looked better was speed to the bottom: its fall ended in June 2022, five months before Bitcoin's. That did not help a holder, because its recovery to the old high took much longer.
The drawdowns were close, 76.63% against 79.30%, so a Bitcoin holder still needed the stomach for a very deep fall. For the cycle question behind that fall, see whether you can trade Bitcoin's long cycle.
What This Test Cannot Tell You
- Costs: fees included at 0.1% on entry and exit; no slippage modelled.
- Structure: long only, one position, no leverage.
- History only: past results do not predict future results.
- One trade each: both cards say "Statistically inconclusive", because a single hold is not a sample.
The Practical Lesson
- Same window, same costs: compare holdings only when the start date, end date and fee match.
- Read the worst fall next to the return: Bitcoin returned 57.33% but fell 76.63% on the way.
- Check the recovery: Ether's fall ended sooner, but its long recovery is what cost holders.
In CoinQuant you can run the same buy and hold record on other coins or windows and compare the cards row by row.
Build trading strategies on real data. No coding required.
Frequently Asked Questions
Has Bitcoin or Ethereum performed better over five years?
Bitcoin, from 1 August 2021 to 1 August 2026. Holding it returned 57.33% with fees, while holding Ether lost 27.95%.
Which fell further in its worst drawdown?
Ether, slightly: its Max Drawdown was 79.30% against 76.63% for Bitcoin. Both falls began on 8 November 2021.
Does the result depend on the start date?
Yes. Both runs bought on 1 August 2021, and a different start or end date would change both returns and could change the order.
Compare any two holdings on the same window and costs before you choose.
Disclaimer:
This content is for educational and informational purposes only and does not constitute financial, investment, or trading advice. All strategies and examples are for illustrative purposes and do not guarantee results. Always conduct your own research before making financial decisions.