
BTC vs ETH: Which Asset Backtests Better With the Same Strategy? (2021-2026)
Bitcoin versus Ethereum is the oldest asset debate in crypto, and it shows up in a different form on every trading question. The version that matters for strategy builders is concrete: if you run the exact same rules on both assets, which one backtests better?
This article answers that question with a controlled test. The same mean reversion strategy, BTC RSI(14) Mean Reversion 1d, was run on BTCUSDT and on ETHUSDT over the same five-year window, August 2021 to August 2026. The rules are identical. Only the asset changes.
The result is a reminder that a bitcoin vs ethereum trading strategy question has no single answer: the strategy made 55.76% on Bitcoin and lost 57.25% on Ethereum. Asset selection was worth more than the strategy itself.
What the RSI Mean Reversion Strategy Does
The strategy is a classic oversold bounce system built on the Relative Strength Index:
Entry: RSI(14) crosses below 30, the oversold threshold, on the daily chart
Exit: RSI(14) crosses back above 50, the midpoint, signaling the bounce has run
It is a long-only mean reversion approach with no leverage, one position at a time, and 100% of equity deployed per entry. The logic assumes that sharp daily selloffs on Bitcoin and Ethereum tend to snap back, and it only acts when the oscillator is genuinely stretched.
Both assets were tested with the exact same settings, so any performance gap is an asset gap, not a settings gap.
Test Setup
| Parameter | Setting |
|---|---|
| Strategy (library name) | BTC RSI(14) Mean Reversion 1d and ETH RSI(14) Mean Reversion 1d |
| Instrument | BTCUSDT and ETHUSDT (spot, Binance) |
| Timeframe | Daily (1D) |
| Tested window | 2021-08-01 to 2026-08-01 (five years) |
| Rules | RSI(14) crosses below 30 to enter, above 50 to exit |
| Direction | Long only, no leverage |
| Initial capital | $10,000 |
| Position size | 100% of equity per entry |
| Fees | 0.1% taker, modeled on every trade |
| Data source | Kaiko via CoinQuant |
The Backtest Results
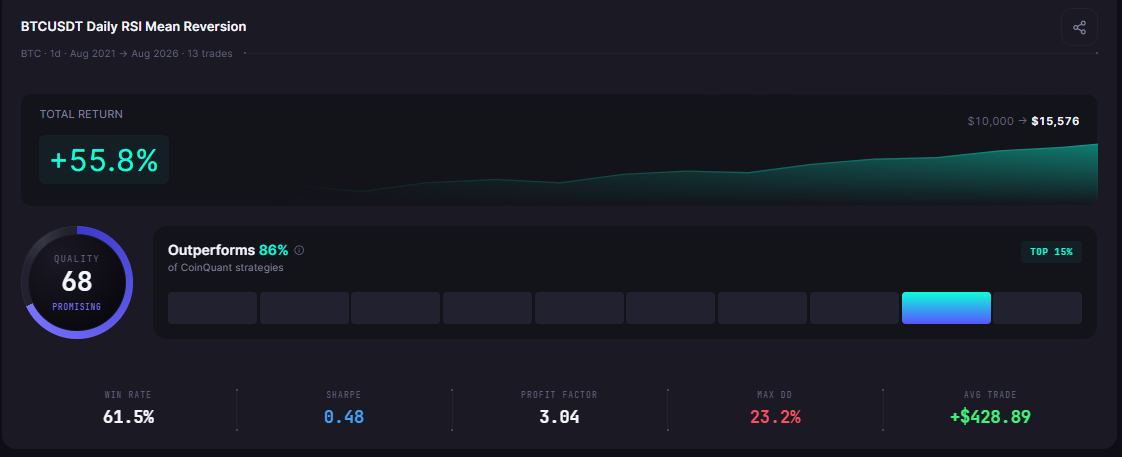
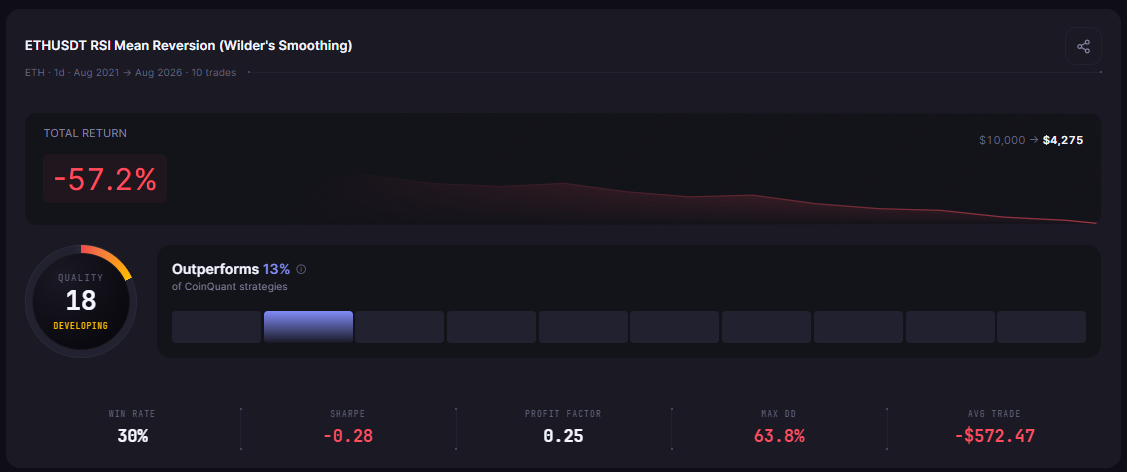
On Bitcoin, the strategy turned $10,000 into $15,575.61 over five years. On Ethereum, the same strategy turned $10,000 into $4,275.31. The same logic produced a profit factor of 3.04 on BTC and 0.25 on ETH.
| Metric | BTC RSI(14) Mean Reversion 1d | ETH RSI(14) Mean Reversion 1d |
|---|---|---|
| Total Return | +55.76% | -57.25% |
| Final Balance | $15,575.61 | $4,275.31 |
| Total Trades | 13 | 10 |
| Win Rate | 61.5% (8W / 5L) | 30.0% (3W / 7L) |
| Profit Factor | 3.04 | 0.25 |
| Sharpe Ratio | 0.48 | -0.28 |
| Sortino Ratio | 0.77 | -0.39 |
| Max Drawdown | 23.21% | 63.76% |
| Average Win | $1,039.26 | $624.71 |
| Average Loss | $547.69 | $1,085.55 |
| Best Trade | +$2,241.48 | +$883.67 |
| Worst Trade | -$1,404.38 | -$4,194.03 |
| Time in Market | 16.04% | 18.28% |
| Total Fees | $364.32 | $124.86 |
What the Data Shows
The gap is not subtle. The reported BTC run returned 55.76% across 13 trades with a profit factor of 3.04, meaning every dollar of gross loss produced 3.04 dollars of gross profit. The ETH run lost 57.25% with a profit factor of 0.25, meaning it produced 25 cents of profit for every dollar lost.
The win rate tells the same story from the other side. BTC delivered 8 winners out of 13 trades. ETH delivered 3 winners out of 10, and its average loss of $1,085.55 was nearly double its average win of $624.71. On ETH the strategy lost more on losers than it made on winners, which is the structural signature of a strategy fighting the asset.
The Drawdown Difference
The most practical number is the max drawdown. The BTC version peaked at 23.21% underwater, uncomfortable but survivable. The ETH version hit 63.76%, which means at the worst point more than six of every ten dollars in the account were gone on paper.
That difference matters for one simple reason: drawdown is what ends strategies. A 63.76% hole needs a 175% gain just to get back to even. Most traders do not sit through that, so the ETH version of this strategy would almost certainly have been abandoned long before the window ended.
Why the Same Strategy Behaves Differently
Mean reversion profits from sharp bounces after panic selling. Bitcoin's daily RSI has repeatedly stretched below 30 during its major selloffs and then snapped back hard, which is exactly the setup this strategy needs. Ethereum's daily moves in the same window were deeper and slower to recover, so the oversold entry kept catching falling knives.
The five-year window includes the 2022 bear market for both assets. BTC bottomed, recovered, and trended into 2024 and 2025. ETH spent longer in drawdown and its recoveries were shallower relative to its declines. A strategy with a 30 threshold and a 50 exit is calibrated for the asset with faster, more violent bounces.
This is the real answer to the asset question: the strategy is not good or bad, it is fitted to Bitcoin's bounce behavior by luck of the settings, and those same settings are a poor match for Ethereum.
The Practical Lesson
A single controlled test settles more than a year of opinion:
Asset selection can outweigh strategy selection. The same rules swung from +55.76% to -57.25%, a spread of 113 percentage points driven by the asset alone
Mean reversion on daily RSI is a Bitcoin-fit pattern. The 30 and 50 thresholds matched BTC bounce behavior and fought ETH's slower recoveries
Drawdown is the binding constraint. 63.76% on ETH would have ended the strategy in practice long before five years passed
Nothing here says ETH is untradeable. It says this strategy on ETH is untradeable, and the fix is to test ETH-specific settings instead of assuming one rule set fits every asset
The disciplined next step is not to pick a side in the BTC versus ETH debate. It is to run the same strategy matrix on both assets, compare the metrics, and let the backtest choose. That is what the CoinQuant multi-asset workflow is for: you build once and test across assets before any capital is at risk.
Run this backtest on both assets yourself and test your own variations on CoinQuant. Backtest both assets free on CoinQuant
Disclaimer:
Key Takeaway