
Bitcoin vs Apple: Five Years of Buy and Hold Side by Side (2021-2026)

Over five years of buy and hold, Apple paid more and hurt less. Measured on bitcoin vs apple stock returns from 2021 to 2026, $10,000 held in Apple grew to $21,687.89 (116.88%), while the same $10,000 in Bitcoin grew to $15,733.43 (57.33%). Bitcoin's worst fall along the way was 76.63%, more than twice Apple's 33.24%.
Both results come from existing strategies in the author's CoinQuant library, each buying on the first bar and holding to the end of the test. The two runs are close but not identical: they differ in fees and in the days they cover, and this article states both.
What follows is two holdings, one period and past prices only, with the results reported without adjustment.
Same Five Years, Two Assets
Each strategy puts $10,000 into one asset on the first available bar and holds it, with 100% of equity in one position. That makes each run a single trade, so the comparison is between holdings, not trading rules.
Buy and hold is the plain baseline most investors start from: no timing, no signals, just the asset and the calendar. If one holding cannot beat the other here, a trading rule on it has a higher bar to clear.
| Parameter | Bitcoin | Apple |
|---|---|---|
| Strategy | BTC Buy and Hold 1D 2021-2026 | AAPL Buy and Hold 1D 2021-2026 |
| Instrument | BTCUSDT (spot, Binance) | AAPL (stock) |
| Window | 2021-08-01 to 2026-08-01, every day | 2021-08-02 to 2026-07-31, 1,255 market days |
| Rule | Buy on the first bar, hold to the end | Buy on the first bar, hold to the end |
| Capital and size | $10,000, 100% of equity | $10,000, 100% of equity |
| Fees | 0.1% on entry and on exit (stored) | No fee stored; 0.02% on entry and on exit charged |
| Slippage | None modelled | None modelled |
The question has a dated backdrop. On 26 October 2026, a Bloomberg report published by Moneyweb said that "concerns over the artificial intelligence trade weighed on cryptocurrencies", so crypto holders and big tech holders were watching the same risk mood. Both runs end by 1 August 2026, before that report.
Bitcoin vs Apple Stock Returns and Drawdown Side by Side
Here are the two holdings on the platform's own figures. CoinQuant, an AI trading platform, reports the same metrics for a stock and a crypto pair, so the rows line up directly.
| Metric | Bitcoin | Apple |
|---|---|---|
| Strategy | BTC Buy and Hold 1D 2021-2026 | AAPL Buy and Hold 1D 2021-2026 |
| Source | CoinQuant library backtest | CoinQuant library backtest |
| Total Return | 57.33% | 116.88% |
| Final Balance | $15,733.43 | $21,687.89 |
| Total Trades | 1 | 1 |
| Win Rate and Profit Factor | n/a (single hold) | n/a (single hold) |
| Max Drawdown | 76.63% | 33.24% |
| Sharpe Ratio | 0.44 | 0.70 |
| Sortino Ratio | 0.63 | 1.02 |
| CAGR | 9.48% | 16.76% |
| Total Fees | $25.74 | $6.31 |
| Verdict | Lower return, deeper fall | Higher return for less pain in this window |
Apple wins on every row that measures reward or risk. The Sharpe Ratio measures return per unit of overall price swing, and the Sortino Ratio counts only the downside swings; on both, Apple scores higher. CAGR is the steady yearly rate that turns $10,000 into the final balance over the window: 9.48% a year for Bitcoin and 16.76% for Apple, as the platform reports them.
Each run is one trade, so each card shows its QUALITY number next to "Statistically inconclusive" (1 trade · needs 50+ to rate): 56 for Bitcoin, 65 for Apple. That is a fair label for a single hold, and it is why this article compares holdings rather than rating strategies.
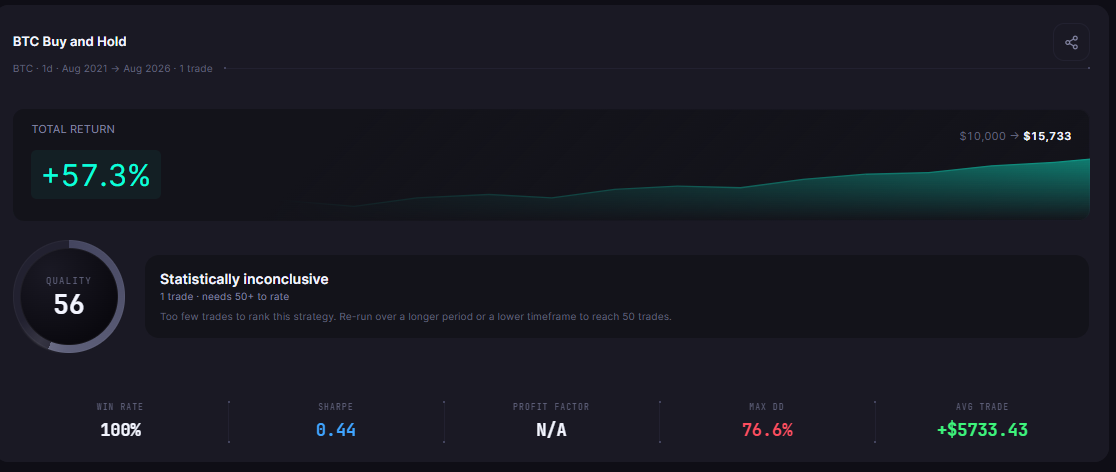
Holding Bitcoin, 2021-08-01 to 2026-08-01 (card header "BTC Buy and Hold", saved as BTC Buy and Hold 1D 2021-2026): one trade, +57.3%, $10,000 to $15,733, QUALITY 56 next to "Statistically inconclusive", and MAX DD
Return for the Pain: Return to Drawdown
Total Return says how much a holding paid. Max Drawdown says how far it fell from a high to a later low, which is the part you have to sit through. Putting the two together gives a simple measure:
- Return to drawdown: Total Return divided by Max Drawdown, using the platform figures.
- Bitcoin: 57.33 divided by 76.63 gives 0.75.
- Apple: 116.88 divided by 33.24 gives 3.52.
Bitcoin paid less than one point of return for each point of its worst fall. Apple paid more than three. In plain terms, a Bitcoin holder in this window watched about three quarters of the peak value disappear before the recovery, while an Apple holder saw about a third. The Sharpe Ratio (0.44 vs 0.70) and Sortino Ratio (0.63 vs 1.02) point the same way, so the answer does not hang on one measure.
The measure has limits. It uses a single worst fall and a single window, so a different start date can change it. For how to read the drawdown figure itself, see Maximum Drawdown in crypto trading: how to read it.
Fees and Trading Days: What Differs Between the Two Runs
The two runs differ in two ways, and neither changes the answer.
- Fees: BTC Buy and Hold 1D 2021-2026 stores a 0.1% fee, charged on entry and on exit, for $25.74 in total. AAPL Buy and Hold 1D 2021-2026 has no stored fee, so the platform default applied: 0.02% on entry and on exit, $6.31 in total.
- Dates: Bitcoin trades every day, so its run covers 2021-08-01 to 2026-08-01. Apple trades on market days only, so the platform moved the requested range to the first and last market days, 2021-08-02 to 2026-07-31, which is 1,255 market days.
With one entry and one exit each, the fee gap is small next to a Total Return that roughly doubled from one asset to the other. The two missing calendar days at the ends of Apple's window are too few to close it.
Both strategies here are existing records in the author's CoinQuant library, one on a coin and one on a stock. CoinQuant's changelog entry of July 27, 2026 says: "CoinQuant now supports 13,100+ assets for backtesting, including stocks, ETFs, indices, forex pairs, and commodities." The Apple record's Performance tab card, below, uses the same layout as the Bitcoin one.
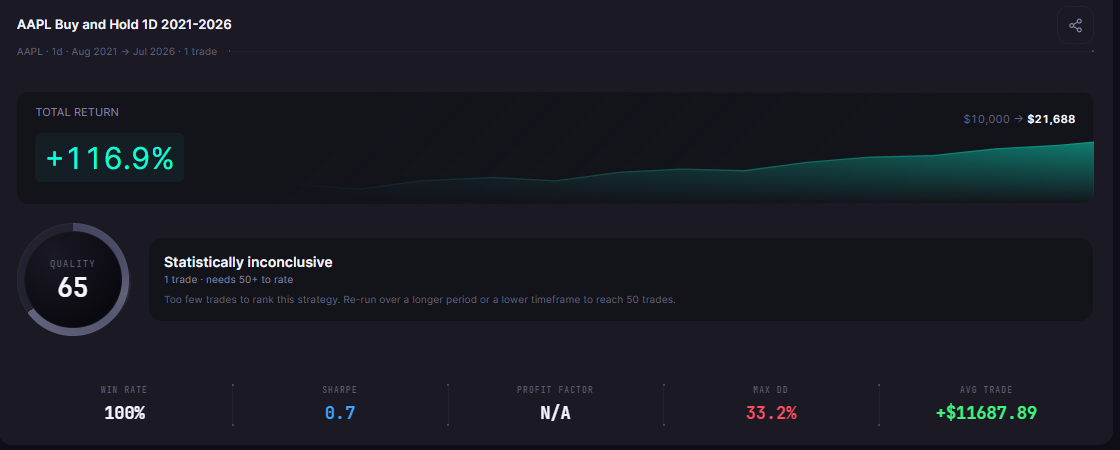
Holding Apple, 2021-08-02 to 2026-07-31 (market days): AAPL Buy and Hold 1D 2021-2026, one trade, +116.9%, $10,000 to $21,688, QUALITY 65 next to "Statistically inconclusive", and MAX DD
For more on what changes when one market closes at weekends and the other never does, see crypto backtesting vs stock backtesting.
What This Comparison Cannot Tell You
This is a narrow result, and it should be read as one:
- Two holdings, one period: a window starting in a different month could rank them differently.
- Past prices only: nothing here is a forecast.
- One trade each: both cards say "Statistically inconclusive", because a single hold is not a sample.
- Costs: fees are included on entry and exit; no slippage was modelled.
- One stock, one coin: Apple is a single company and Bitcoin is a single coin, so this is not a verdict on stocks or crypto as a whole.
- No rules: a trading rule on either asset is a different question.
For that question, the same VIDYA trend rule on Ethereum and Apple tests one rule on both markets, and active trading vs buy and hold in crypto compares five rules with holding.
The Practical Lesson
- Compare return and pain together: Apple's 3.52 return to drawdown beat Bitcoin's 0.75 in this window.
- Match the setup first: check the fee and the days each run covers before you compare.
- Treat one trade as one trade: a single hold describes a period; it does not rate a strategy.
In CoinQuant the Performance tab reports the same metrics for the coin record and the stock record, so the two holdings here line up row by row.
Build trading strategies on real data. No coding required.
Frequently Asked Questions
Did Bitcoin or Apple return more from 2021 to 2026?
Apple. Held from 2021-08-02 to 2026-07-31, $10,000 in Apple grew to $21,687.89 (116.88%). Held from 2021-08-01 to 2026-08-01, the same amount in Bitcoin grew to $15,733.43 (57.33%).
Which had the deeper drawdown?
Bitcoin, by a wide margin: its Max Drawdown was 76.63%, against 33.24% for Apple.
Why do the fees and the dates differ between the two runs?
The Bitcoin strategy stores a 0.1% fee per side, while the Apple strategy has no stored fee, so the platform charged its 0.02% default. Apple also trades only on market days, so its run starts on 2021-08-02 and ends on 2026-07-31.
Read return and drawdown together before you choose a holding or a rule.
Disclaimer:
This content is for educational and informational purposes only and does not constitute financial, investment, or trading advice. All strategies and examples are for illustrative purposes and do not guarantee results. Always conduct your own research before making financial decisions.