
Crypto Backtesting vs Stock Backtesting: What Changes When the Market Never Closes

Crypto backtesting vs stock backtesting comes down to market structure. A stock trades in sessions, with a closing bell, weekends off and gaps between one close and the next open. A crypto pair trades on many exchanges at once, and the daily data in our tests has a bar for every calendar day, weekends included. It can also fall far enough to erase most of an account.
So can you backtest crypto on stock backtesting software? Often you can, but only if the tool handles four things correctly: a continuous calendar, exchange-specific data, a fee on every fill and very deep drawdowns. This article walks through each one using three real buy-and-hold benchmarks from our Strategy Library, tested on Bitcoin, Ethereum and Solana from 2021 to 2026.
No Closing Bell: Sessions, Gaps and Daily Bars
On the New York Stock Exchange, the core trading session runs from 9:30 a.m. to 4:00 p.m. ET, with a pre-opening session from 6:30 a.m. and early 1:00 p.m. closes on November 27 and December 24, 2026. A stock's daily bar covers one session, and nothing prints on weekends or holidays.
The crypto data in these tests has no session to close. Our BTC Buy and Hold 1D 2021-2026 benchmark ran on 1,827 daily bars across 1,826 days (August 1, 2021 to August 1, 2026): one bar for every calendar day, weekends included. In these tests each daily bar is stamped at 00:00 UTC, so "the close" is a clock time, not a closing auction. For 24/7 market backtesting, the practical check is whether the daily series has a bar for every calendar day.
That changes three things in a backtest:
Indicator periods cover different spans. A 50-bar average is 50 calendar days in crypto but roughly ten calendar weeks of trading days on a stock.
Weekend gaps disappear. Rules built around Monday gaps or overnight gaps do not translate, because the daily series has no weekend break.
"Daily" needs a definition. The tool should state what time its daily bar closes, and it should not skip weekend bars.
Which Market's Price? Exchange-Specific Data
In crypto, the same pair trades on many exchanges, each with its own order book, candles and fees. A crypto backtest therefore has to say whose price it used.
All three benchmarks here use Binance spot data, supplied by Kaiko via CoinQuant: BTCUSDT, ETHUSDT and SOLUSDT on the daily timeframe. The pairs are quoted in USDT, a stablecoin, rather than in US dollars. That is another detail a stock-first tool may not surface.
As a general rule, the choice of venue matters most for short timeframes and thin pairs, where candles from different exchanges can diverge. On a daily chart of a major pair the differences tend to be smaller, but a test should still record the exchange so that anyone can reproduce it.
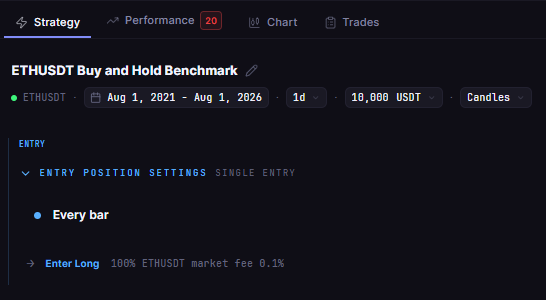
ETH Buy and Hold 1D 2021-2026 in the CoinQuant strategy builder: the test names its market, ETHUSDT on the daily timeframe, with Binance spot data behind it.
Screenshot from the author's CoinQuant account. Backtest results are hypothetical, based on historical data with modelled fees, and do not guarantee future performance. Not financial advice.
Fees on Every Fill
Every buy and every sell pays a fee, and in a percentage fee model the cost scales with the size of the position at that moment. In these tests the fee is a 0.1% taker fee on each market order. That is the test assumption, not a quote of any exchange's fee schedule.
Even buy and hold pays twice, once to enter and once at the end of the test:
BTC Buy and Hold 1D 2021-2026: $25.74 in total fees
ETH Buy and Hold 1D 2021-2026: $17.20
SOL Buy and Hold 1D 2021-2026: $31.01
Those totals are small because each benchmark traded only once. An active strategy pays the same fee on every entry and exit, so a system with dozens of round trips can see costs eat a large share of its edge. No slippage was set in these runs, so the results are fee-inclusive with zero slippage. For why fees, slippage and data mode decide whether results are real, see Backtesting Data Quality.
Drawdown Risk in These Crypto Benchmarks
Here is what simply holding each asset did over the same five-year window, with identical capital, sizing and fees.
| Strategy | Total Return | Max Drawdown | Sharpe Ratio | Final Balance |
|---|---|---|---|---|
| SOL Buy and Hold 1D 2021-2026 | +110.02% | 96.27% | 0.64 | $21,002.12 |
| BTC Buy and Hold 1D 2021-2026 | +57.33% | 76.63% | 0.44 | $15,733.43 |
| ETH Buy and Hold 1D 2021-2026 | -27.95% | 79.30% | 0.26 | $7,205.03 |
Solana more than doubled the account, yet at its worst point the position was 96.27% below its peak. Bitcoin finished up 57.33% after a 76.63% fall. Ethereum ended below its starting value after a drawdown of 79.30%.
The Sharpe ratios tell the same story from another angle: 0.64, 0.44 and 0.26 are modest for five years of exposure, because the swings along the way were so large.
These are crypto numbers only. We did not run a matched stock benchmark, so the table does not measure how much riskier crypto is than stocks. What it shows is what a crypto backtester must be ready to report: drawdowns deep enough that sizing and exits matter as much as entries.
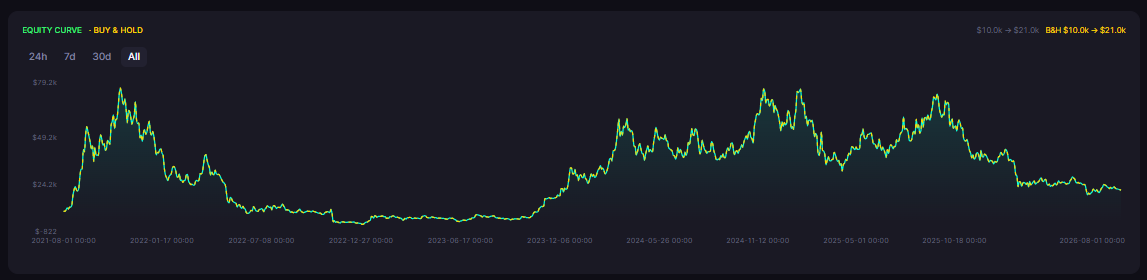
Buy and hold on crypto, 2021 to 2026: SOL Buy and Hold 1D 2021-2026 fell 96.27% from its peak before finishing up 110.02%.
Screenshot from the author's CoinQuant account. Backtest results are hypothetical, based on historical data with modelled fees, and do not guarantee future performance. Not financial advice.
Crypto Backtesting vs Stock Backtesting: What to Check in a Tool
Use these checks on any backtesting software for crypto, whether it was built for stocks or not:
| Check | Why it matters in crypto | Ask the tool |
|---|---|---|
| Continuous calendar | Crypto prints a bar every day, weekends included | Does a daily test include weekend bars, and when does the daily bar close? |
| Exchange-specific data | Each exchange has its own prices and candles | Which exchange and data provider does the test use? |
| Fee model | Every fill pays, and costs compound with trade count | Are fees applied on both entry and exit, and can I set them? |
| Drawdown reporting | Crypto drawdowns can approach total loss | Is max drawdown reported with the equity curve? |
| Benchmark | A strategy must beat simply holding | Can I compare against buy and hold on the same window? |
A stock backtester asks what happened between the open and the close. A crypto backtester has to account for every day, on a named exchange, with a fee on every fill.
CoinQuant, an AI trading platform, covers these checks for crypto: Kaiko data via CoinQuant, order-level maker and taker fees and a Buy and Hold benchmark line (changelog, January 26 and April 27, 2026). It is not crypto-only, either: its July 27, 2026 update added stocks, ETFs, indices, forex pairs and commodities. Its FAQ lists bar data only for stocks, ETFs, forex and commodities. For platform head-to-heads, see CoinQuant vs MetaTrader 5 and CoinQuant vs NinjaTrader.
The Practical Lesson
Check the calendar first. A crypto test should have a bar for every day in the window.
Name the exchange. Results depend on whose price you tested.
Count fees per fill. Buy and hold paid between $17.20 and $31.01 in these tests; an active strategy pays on every trade.
Expect deep drawdowns. 96.27%, 79.30% and 76.63% were the worst falls of simply holding SOL, ETH and BTC from 2021 to 2026.
Build trading strategies on real data with no coding required, then let the test tell you what the chart cannot. Test on crypto-native data with fees on every fill. See why traders choose CoinQuant
Disclaimer:
Key Takeaway
