
Can a Crypto Trend Rule Trade Apple Stock? The Same VIDYA Rule on Ethereum and AAPL (2021-2026)
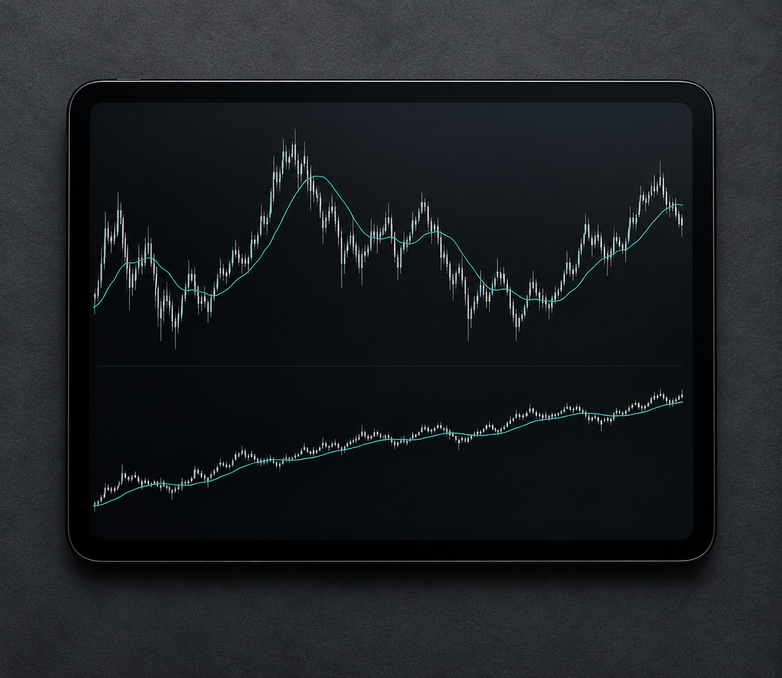
Can an Apple stock trend strategy be as simple as a rule you already run on crypto? We took the exact VIDYA rule from an Ethereum test, buy when the daily close crosses above VIDYA(14) and sell when it crosses back below, and ran it unchanged on AAPL. From August 2021 to July 2026 it returned 39.24% over 55 trades, with a Max Drawdown of 27.28%.
That is a profit, but simply holding Apple did far better: AAPL Buy and Hold 1D 2021-2026 returned 116.88%, with a deeper Max Drawdown of 33.24%. On Ethereum, the same rule lost 27.43%.
The author ran every backtest on CoinQuant with no coding required. This article reports the results without adjustment: no tuned parameters, no cherry picked dates.
Why Test a Crypto Rule on a Stock
Stocks and crypto now sit one tap apart for many traders. TradingView's blog lists "Trade US stocks, ETFs, and options with Clear Street on TradingView" (6 October 2026), and Robinhood's HOOD Summit post of 29 September 2026 announced plans for 24/7 weekend trading of equities. So a crypto trader with a working rule will sooner or later ask whether it carries over.
CoinQuant, an AI trading platform, covers both markets in one place: its Supported Assets page lists 13,151 instruments across six asset classes, including 7,711 stocks and 48 crypto pairs (19 October 2026). That makes it a fair place to run the same strategy on stocks and crypto and compare.
The Rule: Daily Close Crosses VIDYA(14), as on Ethereum
VIDYA (Variable Index Dynamic Average) is a moving average that changes its speed with momentum. CoinQuant's indicator docs describe it as speeding up when the market trends and slowing down when it is quiet, using the Chande Momentum Oscillator as its volatility input. The rule is the one from our VIDYA strategy backtest on Ethereum, word for word, so this AAPL backtest changes only the market:
- Entry: the daily close crosses above VIDYA (period 14, on the close).
- Exit: the daily close crosses below VIDYA (period 14).
- Nothing else: no stop loss, no take profit, no filter.
| Parameter | Setting |
|---|---|
| Strategy | AAPL VIDYA 14 Close Cross 1D 2021-2026 |
| Instrument | AAPL (Apple stock), daily bars |
| Data | Stock data via CoinQuant, trading days only |
| Tested window | 2021-08-01 to 2026-08-01 requested; data runs 2021-08-02 to 2026-07-31 |
| First trade to last exit | 2021-09-23 to 2026-07-31 |
| Direction | Long only, one position at a time, no leverage |
| Initial capital | $10,000 |
| Position size | 100% of equity per entry |
| Fees | No fee set in the strategy, so the platform default for stocks applied: 0.02% per fill (no slippage set) |
| Baselines | AAPL Buy and Hold 1D 2021-2026; BTC Buy and Hold 1D 2021-2026 |
Apple Stock Trend Strategy Results: Five Years on AAPL
The rule turned $10,000 into $13,924.41, a Total Return of 39.24% and a CAGR of 6.85% (the yearly growth rate that compounds to the same total). It won 15 of its 55 trades, a Win Rate of 27.27%, but its average winner ($811.84) was close to four times its average loser ($206.33), which is why the Profit Factor is 1.48.
| Metric | AAPL VIDYA rule | AAPL Buy and Hold | BTC Spot Comparison |
|---|---|---|---|
| Strategy | AAPL VIDYA 14 Close Cross 1D 2021-2026 | AAPL Buy and Hold 1D 2021-2026 | BTC Buy and Hold 1D 2021-2026 |
| Total Return | +39.24% | +116.88% | +57.33% |
| Final Balance | $13,924.41 | $21,687.89 | $15,733.43 |
| Total Trades | 55 | 1 | 1 |
| Win Rate | 27.27% (15W / 40L) | n/a (single hold) | n/a (single hold) |
| Profit Factor | 1.48 | n/a (single hold) | n/a (single hold) |
| Sharpe Ratio | 0.46 | 0.70 | 0.44 |
| Max Drawdown | 27.28% | 33.24% | 76.63% |
| CAGR | +6.85% | +16.76% | +9.48% |
| Total Fees | $238.90 | $6.31 | $25.74 |
All three runs start with $10,000 at 100% of equity, but two inputs differ. The AAPL runs trade on trading days only (2021-08-02 to 2026-07-31) at 0.02% per fill, while BTC trades every day from 2021-08-01 to 2026-08-01 at 0.1% on entry and exit.
With 55 trades the run clears the 50 trade bar, so the results card on the Performance tab rates it with a Quality score of 48.
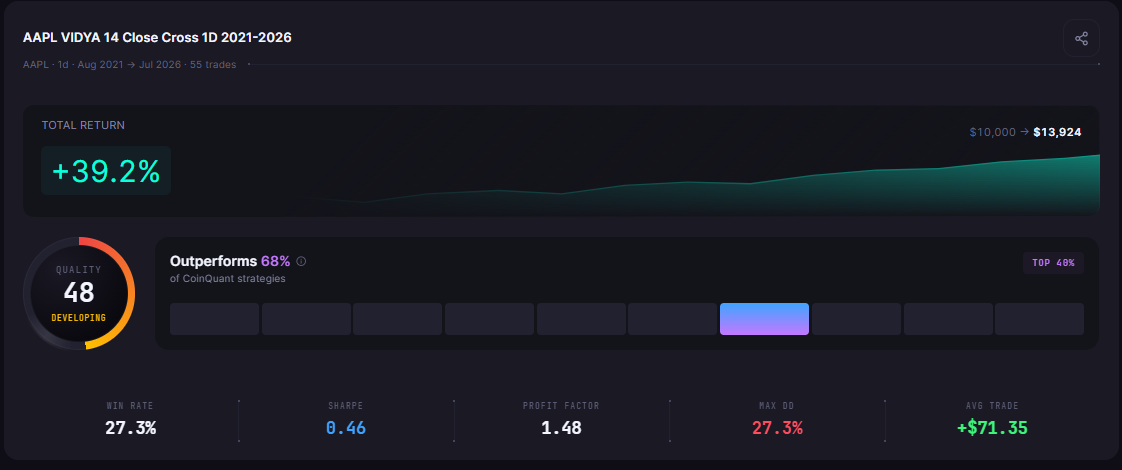
AAPL VIDYA 14 Close Cross 1D 2021-2026 results card: 55 trades, +39.2%, $10,000 to $13,924, Quality score 48.
Buy and Hold Comparison: AAPL Held on the Same Window and Fee Basis
Holding Apple for the whole window returned 116.88%, about three times the rule's 39.24%. The rule's one clear advantage was risk: a Max Drawdown of 27.28% against 33.24% for holding, and it spent only 56.81% of the time in the market.
Both AAPL runs pay the same stock fee of 0.02% per fill. The platform's Buy and Hold benchmark carries no fees and ends at 117.77%, so the table uses the AAPL Buy and Hold 1D 2021-2026 strategy (116.88%), which pays the 0.02% fee on entry and exit ($6.31 in total). The rule paid $238.90 because it traded 55 times.
The trade list adds detail. The median trade lost $97.10 after fees, and the result leans on a few long holds: the best trade ran from 2025-08-06 to 2026-01-05 and made $2,604.20 after fees. Every exit to cash risks missing the next leg up, and on a stock that more than doubled over the window, the rule gave up most of the gain in exchange for a shallower drawdown.
Same Rule, Two Markets: ETH vs AAPL
On Ethereum, the same rule did much worse. ETH VIDYA(14) Cross 1D 2021-2026 lost 27.43% over 75 trades, with a Max Drawdown of 59.85%.
| Metric | On Apple stock | On Ethereum |
|---|---|---|
| Strategy | AAPL VIDYA 14 Close Cross 1D 2021-2026 | ETH VIDYA(14) Cross 1D 2021-2026 |
| Data and window | AAPL, trading days 2021-08-02 to 2026-07-31 | ETHUSDT (spot, Binance), Kaiko via CoinQuant, 2021-08-01 to 2026-08-01 |
| Total Return | +39.24% | -27.43% |
| Total Trades | 55 | 75 |
| Win Rate | 27.27% | 16.00% |
| Profit Factor | 1.48 | 0.86 |
| Sharpe Ratio | 0.46 | 0.05 |
| Max Drawdown | 27.28% | 59.85% |
| Fee per fill | 0.02% (platform default for stocks) | 0.1% |
| Total Fees | $238.90 | $1,189.84 |
Same rule, opposite results. That suggests the market, more than the rule, drove the outcome here: Apple rose over the window while the platform's Buy and Hold benchmark for ETH, which charges no fees, lost 27.81%. Over the full window ETH ended below where it started, which left a long only trend rule less to work with.
The bar structure differs too. Every AAPL fill landed on a weekday, stamped 04:00 or 05:00 UTC, while the ETH rule filled on all seven days of the week at 00:00 UTC. The Trades tab shows it from the first rows.
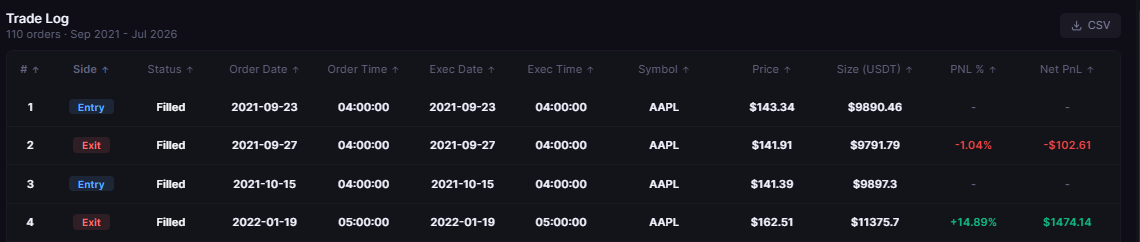
AAPL VIDYA 14 Close Cross 1D 2021-2026 trade log, order rows 1 to 4: Entry and Exit rows marked Filled from 23 September 2021 to 19 January 2022; the log counts 110 orders, times in UTC.
What This Test Cannot Tell You
- One stock, one rule, one window: Apple from 2021 to 2026 is a single path. Another stock, or a window with a long decline, could flip the comparison with holding.
- Different bar counts: stocks trade on weekdays only, so five years hold far fewer AAPL bars than ETH bars, and a 14 bar VIDYA covers more calendar time on AAPL.
- Different fee bases: 0.02% per fill on AAPL against 0.1% on ETH. No slippage was set on any run, so real fills could be worse.
- A sample just over the line: 55 trades clears the 50 trade bar for a rating, but only just.
For what else changes between the two markets, see crypto backtesting vs stock backtesting.
The Practical Lesson
- The rule carried over: on AAPL it made 39.24% with a Profit Factor of 1.48, where on ETH it lost 27.43%.
- Holding still won: AAPL Buy and Hold returned 116.88%, about three times the rule.
- The trade off was risk: the rule's Max Drawdown was 27.28% against 33.24% for holding.
Before you port a crypto rule to stocks, test it against holding the same stock on the same fee basis. In CoinQuant you can run the identical rule on another stock or ETF, or add a trend filter (it supports multi-indicator and multi-timeframe conditions).
Build trading strategies on real data. No coding required.
Frequently Asked Questions
Can you use a crypto trading strategy on stocks?
Yes, if the rule is written as conditions on price, it runs the same way on a stock. Our VIDYA rule ran unchanged on AAPL, but stocks trade on weekdays only and carry a different fee basis, so check both before you compare.
Does a trend rule work on Apple stock?
In this test it made money, 39.24% over 55 trades from 2021 to 2026, but it trailed simply holding AAPL, which returned 116.88%. Its Max Drawdown was lower, 27.28% against 33.24%.
What is VIDYA in trading?
VIDYA, the Variable Index Dynamic Average created by Tushar Chande, is a moving average that adjusts its speed to momentum. It follows price closely in strong trends and flattens out when the market is quiet.
Test the same VIDYA rule on Apple, or on your own stock.
Disclaimer:
Key Takeaway