
Klinger Volume Oscillator Strategy Backtest on Bitcoin: Does Volume Pressure Beat Buy and Hold?
Most volume indicators ask whether volume is rising or falling. The Klinger volume oscillator strategy asks a sharper question: is volume pushing price up, or pulling it down? The Klinger oscillator compares two exponential moving averages of volume force, and when the faster line crosses the slower one, the signal is that money flow has changed direction. The logic is popular because it pairs trend timing with real volume data, but popularity is not a result.
This article backtests the Klinger volume oscillator strategy on Bitcoin against simply holding: same asset, same window, same capital, same fees. One strategy trades 62 times, the other once. The results decide which earned its keep.
The Klinger Volume Oscillator Strategy and the Buy and Hold Baseline
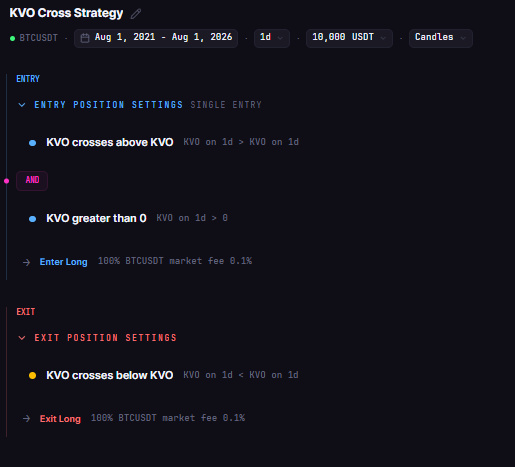
KVO Cross Strategy
The tested cross strategy on the account, built on daily bars:
Entry: Klinger volume oscillator crosses above its 13-period signal line (buy pressure is building)
Exit: Klinger volume oscillator crosses below its 13-period signal line (buy pressure has stalled)
The KVO itself is the difference between a 34-period and a 55-period exponential moving average of volume force, and the signal line is a 13-period exponential moving average of that difference.
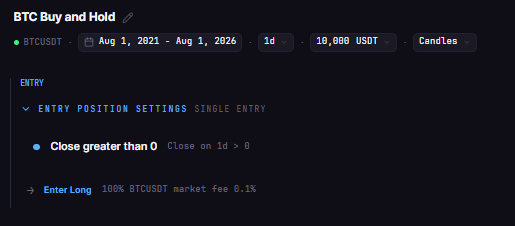
BTC Buy and Hold
The baseline every strategy has to beat:
Entry: at the start of the test window, in cash to fully invested on the first bar
Exit: at the end of the test window, the position is marked to the final close
Both are long only, one position at a time, 100% of equity per entry, 0.1% taker fee modeled, on BTCUSDT daily from August 2021 to August 2026. That window spans the 2022 bear market and the 2024 to 2025 rally, so the cross had to survive both directions of Bitcoin.
Test Setup
| Parameter | KVO Cross Strategy | BTC Buy and Hold |
|---|---|---|
| Strategy | KVO Cross Strategy | BTC Buy and Hold |
| Instrument | BTCUSDT (spot, Binance) | BTCUSDT (spot, Binance) |
| Timeframe | Daily (1D) | Daily (1D) |
| Tested window | 2021-08-01 to 2026-08-01 | 2021-08-01 to 2026-08-01 |
| Entry | KVO (EMA 34 minus EMA 55 of volume force) crosses above 13-period signal | First bar of the window |
| Exit | KVO crosses below 13-period signal | Final close of the window |
| Direction | Long only, no leverage | Long only, no leverage |
| Initial capital | $10,000 | $10,000 |
| Position size | 100% of equity per entry | 100% of equity |
| Fees | 0.1% taker, modeled | 0.1% taker, modeled |
| Data source | Kaiko via CoinQuant | Kaiko via CoinQuant |
The Backtest Results
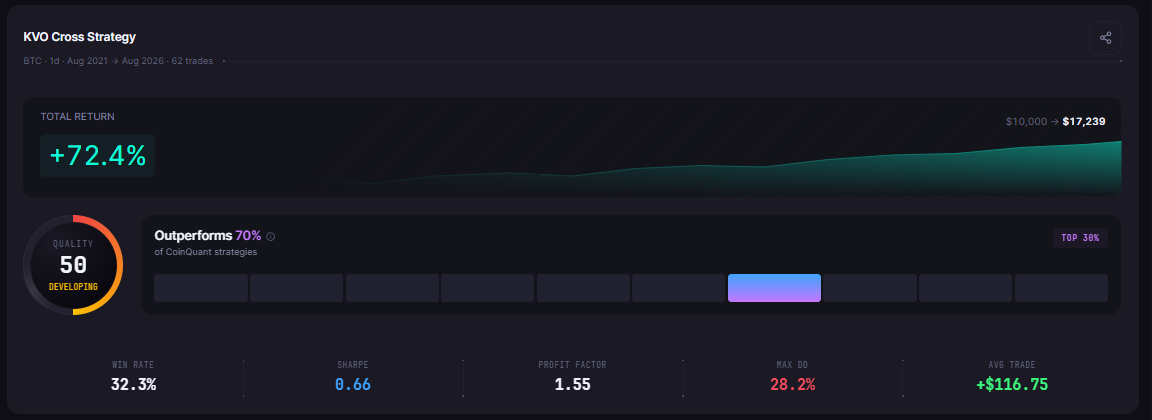
The Klinger cross beat buy and hold on this window, and it did it while being in the market barely one day in seven.
| Metric | KVO Cross Strategy | BTC Buy and Hold |
|---|---|---|
| Total Return | +72.39% | +57.33% |
| Final Balance | $17,238.77 | $15,733.43 |
| Total Trades | 62 | 1 |
| Win Rate | 32.3% (20W / 42L) | 100% (1W / 0L) |
| Profit Factor | 1.55 | n/a (no losing trades) |
| Sharpe Ratio | 0.66 | 0.44 |
| Sortino Ratio | 1.10 | 0.63 |
| Max Drawdown | 28.23% | 76.63% |
| Average Win | $1,015.43 | $5,733.43 |
| Average Loss | $311.19 | n/a |
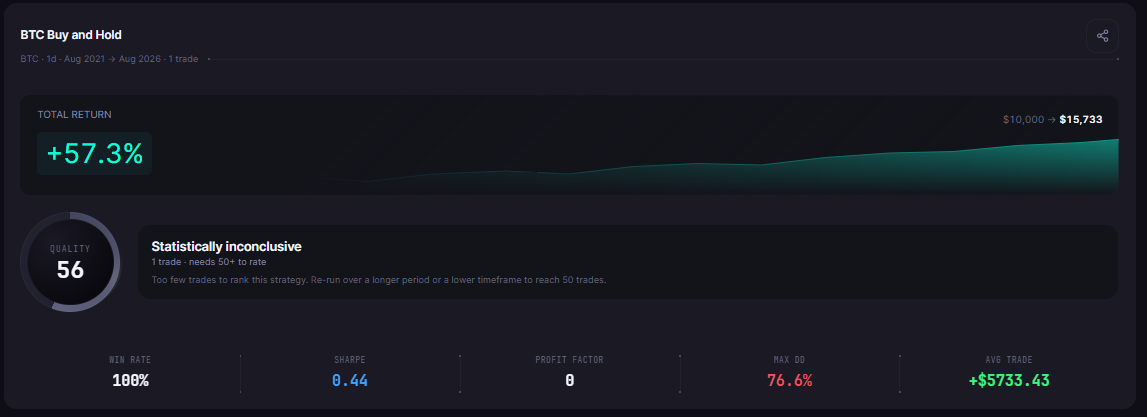
| Best Trade | +$4,133.62 | +$5,733.43 |
| Worst Trade | -$979.71 | n/a |
| Time in Market | 14.12% | 100% |
| Total Fees | $1,757.73 | $25.74 |
What the Data Shows
The headline is the return gap: +72.39% against +57.33%, a 15-percentage-point edge for the Klinger cross. The drawdown column is where the comparison stops being close. Buy and hold rode Bitcoin down 76.63% at its worst point, while the KVO strategy's deepest hole was 28.23%, less than half of it. Sharpe and Sortino tell the same story at 0.66 versus 0.44 and 1.10 versus 0.63: on this five-year daily window, the Klinger strategy delivered more return per unit of risk than simply owning the asset.
The surprising part is how it got there. The KVO strategy won only 20 of its 62 trades, a 32.3% win rate, and it suffered a run of eight consecutive losses. What carried it was the size of the wins: an average winning trade of $1,015.43 against an average loss of $311.19, a payoff ratio of roughly three to one. It lost often and lost small, and the winners paid for all of it. Profit factor landed at 1.55.
The other standout number is time in market at 14.12%: invested only about one bar in seven, the strategy still outperformed an asset fully invested for the whole window. Winning trades lasted roughly nine days on average, losing trades under two, evidence that the cross cut losses quickly and let volume-confirmed trends run.
Why Volume Pressure Beat Holding on This Window
The Klinger cross is a trend follower that enters on volume force rather than on price alone, and that construction had two visible advantages on Bitcoin from 2021 to 2026. First, exits: the cross below the signal line fired quickly when volume pressure stalled, which is why losing trades averaged under two days and the strategy stayed mostly flat through the 2022 bear market instead of absorbing it. Second, the fee math stayed survivable: 62 trades generated $1,757.73 in total fees, and the edge was large enough to pay that bill and still beat buy and hold by 15 percentage points.
The fee line deserves respect. At 0.1% taker per side, a 62-trade strategy pays roughly $1,758 in modeled costs, about 17.6% of the starting capital, and the KVO strategy cleared it. A weaker signal or a tighter market would not have.
None of this is a universal law. This is one indicator configuration, 34-55-13, on one asset, on one five-year window, and the window happened to contain a deep bear market that punished buy and hold severely. What the backtest establishes is that this Klinger cross produced a positive, risk-adjusted result on daily Bitcoin across a full cycle, with an edge built on cutting losers fast rather than on a high win rate.
The Practical Lessons
The Klinger cross returned +72.39% versus +57.33% for buy and hold on daily BTC, 2021 to 2026, with a 28.23% max drawdown against 76.63%
A 32.3% win rate was enough because the average win was about three times the average loss: $1,015.43 against $311.19
The strategy traded only 14.12% of the time, and its losing trades averaged under two days, which is how it sidestepped most of the bear phases
Fees are the tax on active signals: $1,757.73 across 62 trades, and the edge still survived them
Expect losing streaks: eight consecutive losses occurred on this window, so position sizing must tolerate a long run of small defeats before the winners arrive
The Klinger volume oscillator strategy question is answered for this window: on daily Bitcoin from August 2021 to August 2026, the 34-55-13 cross beat buy and hold on return, drawdown, and risk-adjusted metrics, while trading about one day in seven. The natural follow-ups are parameter variations, a weekly timeframe version, or the KVO applied to Ethereum, and each one needs its own backtest before it earns a place in a live strategy.
Run the Klinger cross versus buy and hold yourself and test your own volume rules on CoinQuant. Backtest Klinger volume strategies free on CoinQuant
Disclaimer:
Key Takeaway
