
Winners Ran 8 Days, Losers 2: Inside 202 Ether Trades

In CoinQuant's backtest of an Ether trend rule from 2021 to 2026, winning trades lasted 8 days and losing ones 2 (medians). The rule still lost money: 144 of 202 trades lost, and the small losses added up.
"Let your winners run" is one of the oldest lines in trading, usually paired with "cut your losses short". This rule did both, by design, and still trailed simply holding Ether: it ended at -50.15%, while ETH Buy and Hold 1D 2021-2026 ended at -27.95% over the same five years.
This article measures how long every winner and loser lasted in ETH Hull MA Cross 1D 2021-2026, shows why the short losses outweighed the long wins, and checks how common the pattern is across the CoinQuant library.
The Answer First: "Let Your Winners Run" Held, and It Was Not Enough
CoinQuant, an AI trading platform, ran the rule on five years of daily Ether candles. Of its 202 trades, 58 won and 144 lost. The median winner was held eight days and the median loser two.
So the rule let its winners run and cut its losers short. The problem was the count: for every winning trade there were about two and a half losing ones, and together the losers took more than the winners made.
The Rule and the Settings
The rule buys Ether when the daily close crosses above a 20-period Hull Moving Average (HMA), a fast moving average, and sells when the close crosses back below it. Typed into CoinQuant in plain English, it reads:
Buy ETHUSDT on the daily chart when the close crosses above the Hull Moving Average (period 20). Sell when the close crosses below it. Test from August 1, 2021 to August 1, 2026.
| Parameter | Setting |
|---|---|
| Strategy | ETH Hull MA Cross 1D 2021-2026 |
| Instrument | ETHUSDT (spot, Binance) |
| Data source | Kaiko via CoinQuant |
| Timeframe | Daily (1D) |
| Tested window | 2021-08-01 to 2026-08-01 |
| First trade to last exit | 2021-08-04 to 2026-07-29 |
| Hull MA settings | Period 20, on the close |
| Entry | Close crosses above the HMA(20) |
| Exit | Close crosses below the HMA(20) |
| Direction | Long only, no leverage |
| Initial capital | $10,000 |
| Position size | 100% of equity per entry |
| Fees | 0.1% taker, modelled on every fill (no slippage set) |
| Baselines (same window) | ETH Buy and Hold 1D 2021-2026; BTC Buy and Hold 1D 2021-2026 |
Every one of the 202 exits came from the sell signal; there is no stop loss or profit target. In the app, the backtest header reads "ETHUSDT Hull Moving Average Crossover", the engine name for this library rule. A trend rule on the same Ether data is set against a momentum rule in Momentum vs Trend Following: Two Rules Tested on the Same Ethereum Data (2021-2026).
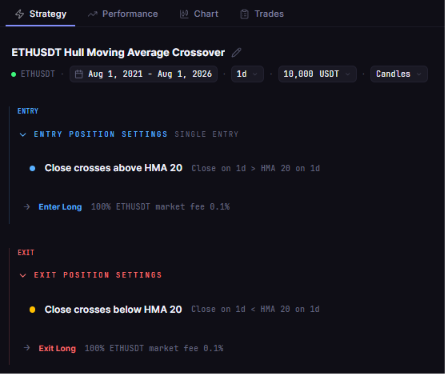
The stored rule of ETH Hull MA Cross 1D 2021-2026 (shown in the app as ETHUSDT Hull Moving Average Crossover) on ETHUSDT daily candles: enter long when the close crosses above the 20 period HMA, listed above the exit when the close crosses back below it.
Winners vs Losers: How Long Each Lasted
Hold time here is the number of days from the entry's Exec Date to the exit's Exec Date in the Trades tab. Both rows of a trade were filled at the close of their UTC day, so a trade held two days spans two daily closes.
| Measure | Winning trades | Losing trades |
|---|---|---|
| Number of trades | 58 | 144 |
| Median hold | 8 days | 2 days |
| Longest hold | 21 days | 14 days |
| Closed within 3 days | n/a | 98 |
| Net PnL, all trades together | $39,039.67 | -$44,054.74 |
The pattern holds trade by trade. Of the 144 losers, 98 were closed within three days, and 76 within two. Twenty of the 58 winners ran ten days or more. A median is used because a few long trades would pull an average up; the difference between the two is set out in Average Trade vs Median Trade: Which Number Tells You What a Typical Trade Made?.
A stretch from the turn of 2024 shows the rhythm. In order rows 199 to 208, three short trades lost within one or two days, one trade held six days won, and then a trade entered on 27 January 2024 ran 21 days to 17 February 2024, the longest winner in the test.
Why Many Short Losses Still Add Up
Each loss was small and quick, but there were many of them. Together the 58 winners made $39,039.67 and the 144 losers lost $44,054.74, so the trades lost money as a whole. The 98 losers closed within three days alone made up nearly three quarters of all the losses.
The Win Rate tells the same story: 28.71%. A trend rule can live with a low Win Rate if each winner is several times the size of a typical loser. Here winners were only about twice the size of a typical loser, so the rule needed to win more often than it did.
Fees add to the count. The rule paid $3,394.92 in fees over five years, because each of the 202 trades paid the 0.1% fee twice. A rule that trades often pays that cost on every short loser too.
How Common This Is: 39 of 41 Rules
The pattern is not special to this rule. Across the CoinQuant library, winners were held longer than losers (by median hold) in 39 of 41 rules with 50+ trades. The count uses each rule's newest backtest, measured on the saved equity curves of library backtests on the team account (read 6 Nov 2026).
The two exceptions are both versions of XRP RSI(14) Mean Reversion 4H, a rule that buys a short dip on 4-hour candles. That fits its design: it aims to sell into a quick rebound.
So "let your winners run" describes most rules in the library well. What it does not tell you is whether the winners pay for the losers. Fifty trades is the floor used for this count; why that matters is covered in How Many Trades Does a Backtest Need Before You Can Trust It?.
Buy and Hold Comparison: Same Coin, Same Window
| Metric | Hull MA rule | ETH Buy and Hold | BTC Spot Comparison |
|---|---|---|---|
| Strategy | ETH Hull MA Cross 1D 2021-2026 | ETH Buy and Hold 1D 2021-2026 | BTC Buy and Hold 1D 2021-2026 |
| Total Return | -50.15% | -27.95% | 57.33% |
| Final Balance | $4,984.92 | $7,205.03 | $15,733.43 |
| Total Trades | 202 | 1 | 1 |
| Win Rate | 28.71% (58W / 144L) | n/a (single hold) | n/a (single hold) |
| Profit Factor | 0.89 | n/a | n/a |
| Sharpe Ratio | -0.08 | 0.26 | 0.44 |
| Max Drawdown | 67.70% | 79.30% | 76.63% |
| CAGR | -12.99% | -6.34% | 9.48% |
| Total Fees | $3,394.92 | $17.20 | $25.74 |
All three runs share the window, the $10,000 starting capital, 100% sizing and the 0.1% fee on entry and exit. The rule fell less deeply than holding Ether (67.70% against 79.30%) but ended lower, with a Total Return of -50.15% against -27.95%. For why CAGR and Total Return read differently, see CAGR vs Total Return: Which Number to Use When Comparing Crypto Backtests.
The equity card's B&H line is the platform's Buy and Hold benchmark, which carries no fees; ETH Buy and Hold 1D 2021-2026 in the table pays the 0.1% fee on entry and exit, so the two differ slightly. On the Performance tab, the rule's QUALITY score of 27 sits next to "Outperforms 26% of CoinQuant strategies". The ETH Buy and Hold card shows QUALITY 20 next to "Statistically inconclusive", because a single trade is below the 50+ it needs to rate.
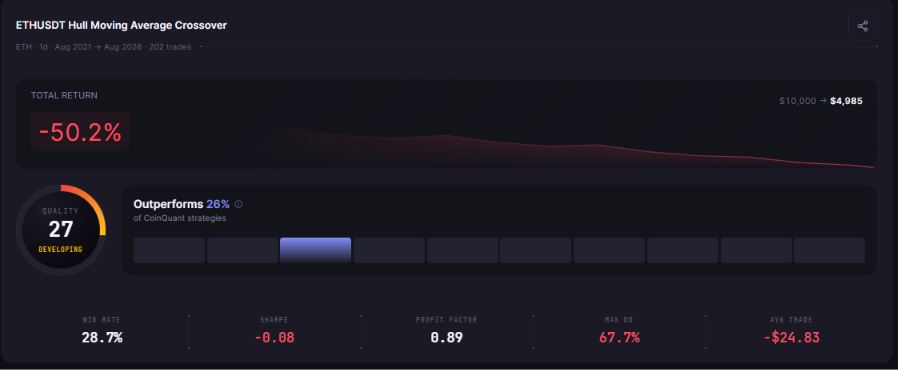
ETH Hull MA Cross 1D 2021-2026 (shown in the app as ETHUSDT Hull Moving Average Crossover), tested from August 2021 to August 2026: 202 trades, -50.2%, $10,000 to $4,985 and QUALITY 27 next to "Outperforms 26% of CoinQuant strategies".
Fees are included and no slippage is modelled. The rule trades long only and one position at a time, with no leverage. Past results do not predict future results.
The Practical Lesson
- Letting winners run is not enough on its own: count how many short losers pay for each long winner.
- Read the median hold of winners and losers: in this rule, eight days against two.
- Check the total of the losers: 144 small losses added up to more than 58 long wins.
Before you trust a rule that "lets winners run", open its Trades tab and add up its short losers. In CoinQuant you can do the same for any rule you build in plain English.
Build trading strategies on real data. No coding required.
Frequently Asked Questions
What does "let your winners run" mean?
It means keeping a winning trade open while it keeps working, instead of selling at the first small gain. It is usually paired with "cut your losses short". This Ether rule did both: its median winner lasted eight days and its median loser two.
How long should I hold a winning trade?
There is no fixed answer; it depends on the rule. In this test, winners lasted eight days at the median and up to 21 days. What mattered more was how many losers came with them.
Why do short losses add up?
Because there can be many of them. In this rule, 144 of 202 trades lost and 98 losers closed within three days. Together the losers lost $44,054.74, more than the $39,039.67 the winners made.
See how a rule's winners and losers stack up.
Disclaimer:
Key Takeaway