
What Bitcoin Did in the 5 Days After a 5% Drop
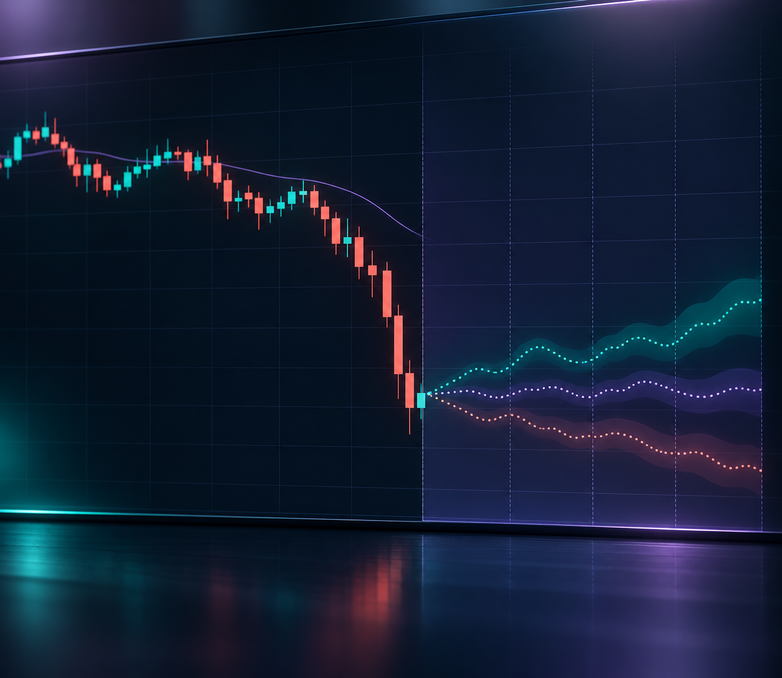
We tested it on CoinQuant: buying Bitcoin at the close of every day that ended 5% or more below the day before, and selling 5 days later, made -22.29% over 52 trades from 1 Aug 2021 to 1 Nov 2026, fees included. Holding Bitcoin over the same window made 96.23%.
So the rule did not just trail holding. It lost money on its own. How often does Bitcoin drop 5% in a day? Less often than it used to: 64 daily closes in this window ended 5% or more below the day before, and another came on 5 November 2026.
This article counts those days by year, shows the exact rule we tested on CoinQuant, an AI trading platform, and reports the result without adjustment: one trigger, one exit, no tuned parameters.
The Answer First: What the 5 Days After a 5% Drop Looked Like
The five days after a big red close were close to a coin toss. Of the 52 trades, 25 made money and 27 lost, a Win Rate of 48.08%. Every trade was closed by the time limit, five days after entry, so none ended early on a stop or a target.
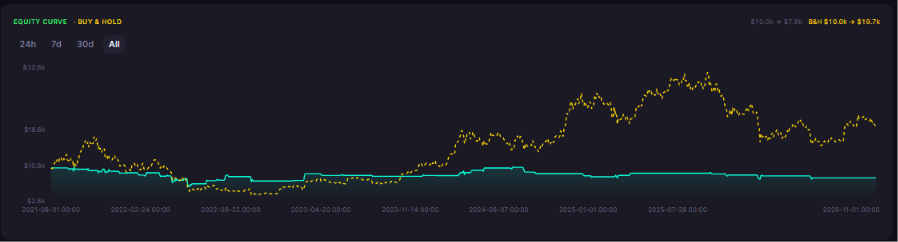
The losers were also larger than the winners: a Profit Factor of 0.82 means the losing trades gave back more than every dollar the winners made. After fees, $10,000 became $7,770.93.
The rule was in cash most of the time. It held Bitcoin on only 13.55% of the days in the window, because a 5% down day is rare and each trade lasts five days.
How Often Does Bitcoin Drop 5%? The Count by Year
We counted every Bitcoin 5% down day since Binance BTCUSDT daily candles begin in August 2017. Method: close to close on closed UTC daily candles, counted to the 5 November 2026 close.
| Year | Daily closes 5% or more below the previous close |
|---|---|
| 2017 (from 17 Aug) | 16 |
| 2018 | 47 |
| 2019 | 18 |
| 2020 | 16 |
| 2021 | 35 |
| 2022 | 24 |
| 2023 | 6 |
| 2024 | 11 |
| 2025 | 7 |
| 2026 (to 5 Nov) | 5 |
The big red days cluster in falling markets. 2018 had 47 of them, while 2023 had only six. In 2026 there were five by 5 November: 29 January, 31 January, 5 February, 2 June and 5 November.
Inside the test window, 1 August 2021 to 1 November 2026, there were 64 such closes. The 5 November 2026 close of 76,088.01 was 5.49% below the 4 November close of 80,504.01. That day falls after the test window, so it is a dated example here, not part of the result.
The Rule, Exactly as Tested
The rule was written in plain English and built on CoinQuant with no code, on the team's CoinQuant account on 6 November 2026. These are the two rule sentences from that prompt, word for word:
Enter long with a market order at the daily close when the daily close is at least 5% below the previous daily close (1-day change of -5% or less). Exit the position automatically 5 days after entry (time-based exit, maximum holding period 5 days).
CoinQuant stored the trigger as a 1-day Rate of Change of the close at -5 or below. That is simply a price drop of 5% or more from one daily close to the next. For a longer walk through the same no-code process, see how to build a Bitcoin strategy in plain English and test it on five years of data.
| Parameter | Setting |
|---|---|
| Strategy | BTC 5% Daily Drop Buy 5-Day Hold 1D Aug 2021-Nov 2026 |
| Instrument | BTCUSDT (spot, Binance) |
| Data source | Kaiko via CoinQuant |
| Timeframe | Daily (1D) |
| Tested window | 2021-08-01 to 2026-11-01 (effective data end 2026-11-01, as the backtest reports) |
| Entry | Daily close 5% or more below the previous daily close (stored as Rate of Change, period 1, at -5 or below), market order at the close |
| Exit | Automatic, five days after entry (maximum holding period) |
| Direction | Long only, one position at a time, no leverage |
| Initial capital | $10,000 |
| Position size | 100% of equity per entry |
| Fees | 0.1% taker, on every entry and exit (no slippage modelled) |
| Baseline (same window) | BTC Buy and Hold 1D Aug 2021-Nov 2026 |
What the Trades Looked Like
BTC 5% Daily Drop Buy 5-Day Hold 1D Aug 2021-Nov 2026 made -22.29% over the window, with a Max Drawdown of 43.17% along the way.
Why 52 trades and not 64? The rule holds one position at a time. The other 12 red closes came while a trade was already open, so the backtest could not act on them. Fees matter too: $872.18 over 52 round trips is a real cost for a rule that loses on average.
With more than 50 trades, the Performance tab card can rate the run. It shows QUALITY 29 next to "Outperforms 29% of CoinQuant strategies".
The last trade shows how each one works. Bitcoin closed more than 5% down on 2 June 2026, so the rule bought at that close and sold five days later. A row stamped 2 June 2026, 00:00 UTC was filled at the close of 2 June UTC.

Order rows 103 and 104 of the drop rule's trade log: the entry on 2 June 2026 and the exit five days later on 7 June 2026, with the price and size of each order and the PNL % and Net PnL of the exit. Times are UTC.
Buy and Hold Comparison: Same Coin, Same Window
Both runs start with $10,000 on 1 August 2021. Holding buys on the first candle and sells on the last, so it is the BTC Spot Comparison here.
| Metric | 5% drop rule | BTC Spot Comparison (same window) |
|---|---|---|
| Strategy | BTC 5% Daily Drop Buy 5-Day Hold 1D Aug 2021-Nov 2026 | BTC Buy and Hold 1D Aug 2021-Nov 2026 |
| Total Return | -22.29% | 96.23% |
| Final Balance | $7,770.93 | $19,622.82 |
| Total Trades | 52 | 1 |
| Win Rate | 48.08% (25 wins, 27 losses) | n/a (single hold) |
| Profit Factor | 0.82 | n/a (single hold) |
| Sharpe Ratio | -0.06 | 0.51 |
| Max Drawdown | 43.17% | 76.63% |
| CAGR | -4.69% | 13.69% |
| Time in Market | 13.55% | 99.95% |
| Total Fees | $872.18 | $29.63 |
Both runs share the same window, capital, sizing and 0.1% fee, so the rows compare like with like. The rule's smaller Max Drawdown, 43.17% against 76.63%, came from sitting in cash, not from buying well.
The Buy and Hold card shows QUALITY 57 next to "Statistically inconclusive" (1 trade · needs 50+ to rate), as any single hold does. For why the same coin is the right benchmark here, see which benchmark a crypto strategy should beat.
The equity card on the Performance tab draws the rule against the platform's Buy and Hold line. That line is the platform's own benchmark and carries no fees, while BTC Buy and Hold 1D Aug 2021-Nov 2026 in the table pays the 0.1% fee on entry and exit, so their end values differ slightly.
When the Rule Helps and When It Does Not
Buying a red day in crypto feels like buying at a discount. This test shows what that idea did on Bitcoin with one fixed exit.
| Where the rule helps | Where it falls short |
|---|---|
| It sits in cash most of the time, which kept its Max Drawdown at 43.17% | It still lost 22.29% while holding gained 96.23% |
| One clear trigger and one exit, written in plain English | A Win Rate of 48.08% and a Profit Factor of 0.82: no edge after fees |
Keep the limits in view:
- Costs: fees included (0.1% taker fee on entry and exit); no slippage modelled.
- Structure: long only, one position at a time, no leverage.
- Scope: one trigger and one exit on one coin. Other drop sizes or holding periods were not tested.
- The future: past results do not predict future results.
Fifty two trades is enough for the card to rate the run, but not a large sample; how many trades a backtest needs before you can trust it explains why. For dip buying in general, see whether buying the dip works in crypto.
The Practical Lesson
- Count the signals first: this trigger fired 64 times in five years and traded 52 times.
- Compare with holding on the same window: the rule made -22.29% while holding made 96.23%.
- Check the exit, not only the entry: with a fixed exit after five days, winners and losers were close to even and fees tipped the result.
A rule built on a rare trigger trades rarely, so count its signals and compare it with holding on the same window before you trust it. In CoinQuant you can change the drop size or the holding period in one plain sentence and test again.
Build trading strategies on real data. No coding required.
Frequently Asked Questions
How often does Bitcoin drop 5% in a day?
On Binance BTCUSDT daily candles, Bitcoin closed 5% or more below the previous close 64 times from 1 August 2021 to 1 November 2026. By year, the count ranged from 47 in 2018 to six in 2023.
Is buying a 5% down day a good idea?
Not on this evidence. Buying each 5% down close and selling five days later made -22.29% over 52 trades, fees included, while holding Bitcoin made 96.23% over the same window.
What happened after the 5 Nov 2026 drop?
Bitcoin closed at 76,088.01 on 5 November 2026, 5.49% below the 4 November close of 80,504.01. That close came after the test window ended on 1 November 2026, so it is not one of the 52 trades. Under the rule, a buy at that close would be sold at the 10 November close.
What if I want to develop a crypto trading strategy without any coding experience?
Describe it in plain English. This rule was written as two plain sentences (see "The Rule, Exactly as Tested") and built and backtested on CoinQuant with no code; how to build a Bitcoin strategy in plain English walks through a full build.
Test the same trigger on your own window, or try a different exit.
Disclaimer:
Key Takeaway