
Which Benchmark Should a Crypto Strategy Beat? Buy and Hold on the Same Coin vs Bitcoin
Choosing a benchmark for crypto trading strategy results can flip the verdict before you read a single metric. Over the same five years, ETH SMA 50/200 Golden Cross 1D 2021-2026 lost 10.83%. That beat ETH Buy and Hold 1D 2021-2026 (-27.95%) and lost badly to BTC Buy and Hold 1D 2021-2026 (57.33%).
Same strategy, same trades, two opposite conclusions. Which one is right depends on the question you are really asking, and most traders never write that question down.
This guide compares six Buy and Hold backtests on one window, one fee and one starting balance, then gives a simple rule for picking the right yardstick. The figures are reported without adjustment.
Why the Benchmark for Crypto Trading Strategy Tests Decides the Verdict
A backtest result on its own is just a number. Total Return only means something next to an alternative you could have chosen instead, and that alternative is your benchmark.
Most traders reach for buy and hold on the same coin. It answers a fair question: did trading this coin beat simply owning it? Our earlier comparison of active trading vs buy and hold in crypto covers that question across five strategies.
The problem starts when the coin itself performed badly. If the coin fell, a strategy can lose money and still "beat" its benchmark. If the coin soared, a solid strategy can look weak, so a second yardstick, usually Bitcoin, tells you whether the whole exercise was worth it.
How We Compared: Method and Data
| Parameter | Setting |
|---|---|
| Strategy | BTC Buy and Hold 1D 2021-2026; ETH Buy and Hold 1D 2021-2026; SOL Buy and Hold 1D 2021-2026; ADA Buy and Hold 1D 2021-2026; BNB Buy and Hold 1D 2021-2026; XRP Buy and Hold 1D 2021-2026 |
| Worked example | ETH SMA 50/200 Golden Cross 1D 2021-2026 |
| Instruments | BTCUSDT, ETHUSDT, SOLUSDT, ADAUSDT, BNBUSDT and XRPUSDT (spot, Binance) |
| Data source | Kaiko via CoinQuant |
| Timeframe | Daily (1D) |
| Tested window | 2021-08-01 to 2026-08-01 |
| Initial capital | $10,000 |
| Position size | 100% of equity per entry; each Buy and Hold run buys on the first bar and holds to the end |
| Fees | 0.1% taker on entry and on exit (no slippage set) |
Data note: the ADAUSDT daily series on CoinQuant is missing 2021-09-12 to 2021-09-14, and the XRPUSDT daily series is missing 2021-09-09 to 2021-09-15. The platform flags neither gap. Total Return uses the first and last bars, so it is unaffected, while Max Drawdown rests on the bars that exist.
Last updated: 8 October 2026.
Six Coins, One Window: Buy and Hold Results
Here is what simply buying each coin on 1 August 2021 and holding it for five years returned, after fees.
| Coin | Strategy | Total Return | Max Drawdown | CAGR | Final Balance |
|---|---|---|---|---|---|
| SOL | SOL Buy and Hold 1D 2021-2026 | 110.02% | 96.27% | 15.99% | $21,002.12 |
| BNB | BNB Buy and Hold 1D 2021-2026 | 72.58% | 69.85% | 11.52% | $17,257.91 |
| BTC | BTC Buy and Hold 1D 2021-2026 | 57.33% | 76.63% | 9.48% | $15,733.43 |
| XRP | XRP Buy and Hold 1D 2021-2026 | 46.13% | 77.87% | 7.88% | $14,613.11 |
| ETH | ETH Buy and Hold 1D 2021-2026 | -27.95% | 79.30% | -6.34% | $7,205.03 |
| ADA | ADA Buy and Hold 1D 2021-2026 | -86.76% | 95.15% | -33.24% | $1,324.39 |
All six runs share the same window, capital, sizing and fee, so the rows compare like with like. The spread is the point: from 110.02% on SOL to -86.76% on ADA, the bar a strategy must clear depends almost entirely on which coin it trades.
Three patterns stand out:
- Two beat Bitcoin: SOL and BNB finished ahead of BTC's 57.33%; XRP, ETH and ADA did not.
- Two lost money: a strategy on ETH or ADA can post a loss and still beat its own coin.
- Deep falls everywhere: no Max Drawdown was below 69.85%, so holding any of them meant sitting through a deep fall.
ADA shows the extreme case. Its baseline turned $10,000 into $1,324.39, which makes almost any ADA strategy look good next to it.
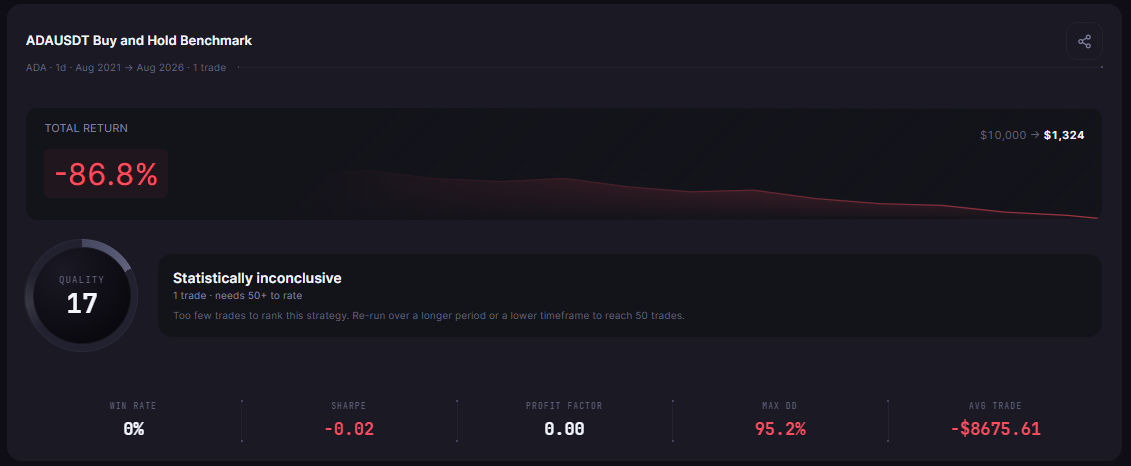
ADA Buy and Hold 1D 2021-2026 in CoinQuant: -86.76% Total Return and a 95.15% Max Drawdown from 2021-08-01 to 2026-08-01, the low bar an ADA strategy is measured against.
Same-Coin Buy and Hold: When It Is the Right Yardstick
Use the same coin as your benchmark when your real choice is to trade that coin or hold it. You already own ETH, or you have decided to put money into ETH, and the question is whether rules add value over doing nothing.
In that case the same-coin baseline is exactly right. It strips out the coin's own direction and asks a narrow question: did the timing help?
CoinQuant draws this comparison for you. Since the 27 April 2026 update, backtests show a Buy and Hold line next to the strategy's equity curve (changelog). That line carries no fees, so it ends slightly differently from a full Buy and Hold backtest; on ETH the line finishes at -27.81% against -27.95% for the fee-paying run.
Watch for two traps:
- Falling coin: beating -27.95% on ETH still left the trader with less money than they started with.
- Soaring coin: a SOL strategy has to clear 110.02% before the same-coin test calls it a win.
Bitcoin as the Yardstick: When It Is the Fairer Test
Use Bitcoin when the real choice is which asset to own at all. If you are deciding whether to run an altcoin strategy or simply hold BTC, the altcoin's own chart is the wrong comparison.
Bitcoin is the natural default because it is the asset most crypto traders would hold if they did nothing clever. Over this window it returned 57.33% with a 76.63% Max Drawdown, so it is a demanding but realistic bar.
| Your real question | Benchmark to use | Why |
|---|---|---|
| Does trading this coin beat holding it? | Buy and hold on the same coin | Isolates the effect of your entry and exit timing |
| Is this strategy worth running instead of just owning crypto? | BTC buy and hold | Measures the result against the simplest crypto alternative |
| Is it worth taking any market risk at all? | Cash (no return) | A losing strategy fails this test whatever the benchmarks did |
You do not have to pick only one. Reporting a result against both the same coin and Bitcoin is the honest default.
Worked Example: One Result, Two Verdicts
ETH SMA 50/200 Golden Cross 1D 2021-2026 buys ETHUSDT when the 50-day SMA crosses above the 200-day SMA and sells when it crosses below. Over the same window and settings it made five trades and finished at $8,917.28.
| Yardstick | Benchmark Total Return | Strategy Total Return | Verdict |
|---|---|---|---|
| ETH Buy and Hold 1D 2021-2026 | -27.95% | -10.83% | Beat the benchmark |
| BTC Buy and Hold 1D 2021-2026 | 57.33% | -10.83% | Lost to the benchmark |
| Cash | No gain, no loss | -10.83% | Lost money |
The same-coin test says the crossover helped: it lost far less than holding ETH, and its 61.46% Max Drawdown was shallower than ETH's 79.30%. The Bitcoin test says an ETH trader would have been better off owning BTC. Both statements are true, and they answer different questions.
Five trades in five years is also a very small sample, so neither verdict proves an edge. For how to read the rest of the report, see how to read a backtest report. For what a realistic result looks like across strategies, see realistic crypto trading returns.
The Practical Lesson
- Name it first: write down whether you are asking "trade this coin or hold it" or "this strategy or Bitcoin".
- Report both: a crypto trading strategy that beats its own coin but trails BTC has a narrower case than its headline suggests.
- Check the coin first: ETH at -27.95% and ADA at -86.76% made their same-coin bars unusually low over this window.
- Keep cash in view: a strategy that lost money did not succeed, whatever it beat.
CoinQuant, an AI trading platform, makes the two-benchmark habit cheap. Backtests show a Buy and Hold line next to the equity curve, and saved baselines such as BTC Buy and Hold 1D 2021-2026 sit in the Strategy Library next to the strategies they judge.
Build trading strategies on real data. No coding required.
Frequently Asked Questions
What benchmark should I compare my crypto trading strategy to?
Start with buy and hold on the same coin and buy and hold on Bitcoin, over the same window and with the same fees. The same-coin test shows whether your timing helped; the Bitcoin test shows whether the strategy beat the simplest crypto alternative.
Should an altcoin strategy beat Bitcoin or buy and hold on the same coin?
Ideally both. If you are committed to the altcoin, the same-coin benchmark is the main test; if you are choosing what to own, Bitcoin is. Here only SOL and BNB beat Bitcoin's 57.33%, so for XRP, ETH and ADA strategies the same-coin bar was the lower one.
Is beating buy and hold enough to call a strategy good?
No. ETH SMA 50/200 Golden Cross 1D 2021-2026 beat ETH buy and hold and still lost 10.83%, and it made only five trades. Check the result against Bitcoin and against cash, and make sure the sample is large enough to mean something.
Compare your own strategy against its coin and against Bitcoin in one place.
Disclaimer:
This content is for educational and informational purposes only and does not constitute financial, investment, or trading advice. All strategies and examples are for illustrative purposes and do not guarantee results. Always conduct your own research before making financial decisions.