
What a Liquidation Cascade Looks Like on a Daily Candle, and What a Backtest Records

What is a liquidation cascade? It is a chain of forced selling: a falling price closes out leveraged long positions, those forced sales push the price lower and the lower price closes out the next layer. That is the liquidation cascade meaning in one line: losses that feed on themselves, often within hours.
The liquidation cascade crypto traders saw on 29 October 2026 shows how little of that a daily candle keeps. Liquidation counts for that day ran from about $1 billion to $1.5 billion, depending on the source and the window. Bitcoin's Binance daily candle simply closed 4.12% below the close of the day before.
This guide explains what a candle keeps and what it hides. Then it shows what a backtest that trades on daily closes records on a cascade sized day, using one trade log from a CoinQuant backtest the author ran: XRP DEMA 20 Close Cross 1D 2021-2026.
Liquidation Cascade Crypto Basics: What It Is
Leverage lets a trader hold a position larger than the cash behind it. The exchange holds that cash as margin, and when losses eat through it, the exchange closes the position at market. A long position is closed by selling, so a wave of long liquidations is a wave of market sell orders.
A long liquidation cascade starts when price falls far enough to trigger the first group of these forced sales. The selling pushes price to the next group's liquidation level, and so on, until buyers absorb it or the leverage is gone. A short cascade runs the other way, with forced buying.
A spot position with no leverage cannot be liquidated: it only gains or loses value. For what 2x and 3x would have meant on a real coin, see spot vs leveraged crypto trading on BNB.
29 October 2026, as a Dated Example
Two sources counted that day differently, so the total depends on the window each one used.
| Source | Window | Liquidated | Long positions |
|---|---|---|---|
| MarginPad daily recap | UTC day of 29 October 2026 | $985.7M | $838.9M (85%) |
| Market update by Terence Zimwara, published 30 October 2026 | By the morning of 30 October 2026 | More than $1.54 billion | Most of the total, by its count |
The fair summary is about $1 billion to $1.5 billion, depending on the source and the window, with longs taking most of it. Sources: MarginPad's daily recap for 29 October 2026 and the market update of 30 October 2026 by Terence Zimwara.
MarginPad also timed it. Its heaviest hour was 20:00 to 21:00 UTC, and the recap notes that "liquidation cascades cluster, they don't spread evenly."
On Binance's BTCUSDT daily candles (UTC), Bitcoin closed at 81,343.50 on 28 October 2026 and at 77,991.89 on 29 October 2026, a fall of 4.12% close to close.
What a Daily Candle Keeps and What It Hides
A daily candle keeps four prices: the open, the high, the low and the close. It shows how far price went during the day, not the order things happened in, how fast they happened or how much traded at each level.
| Candle field | BTCUSDT, 29 October 2026 (Binance, UTC) |
|---|---|
| Open | 81,343.51 |
| High | 81,971.00 |
| Low | 77,910.00 |
| Close | 77,991.89 |
Read on its own, that candle says Bitcoin traded as high as 81,971.00 and as low as 77,910.00 during the day and closed just above its low. It cannot show which came first, or that, by MarginPad's count, the heaviest burst of forced selling landed in a single evening hour.
Some candles hide far more. On 10 October 2025, XRPUSDT's daily candle on Binance closed at 2.3704, a fall of 15.41% from the previous close of 2.8021, yet the candle's low was 1.2543, less than half of that previous close. That day is the subject of a stress test of an XRP trend strategy through the October 10, 2025 crash.
Common Mistakes When Reading a Cascade Candle
- Treating the close as the whole day: the close to close change hides the worst point of the day.
- Treating the low as a price you could sell at: in a cascade, the low is often a brief print inside the fastest selling.
What a Candle-Based Backtest Records on a Day Like That
The worked example is XRP DEMA 20 Close Cross 1D 2021-2026, a trend rule the author tested on CoinQuant. Its test window ends on 1 August 2026, so it does not cover 29 October 2026; the example uses a cascade sized day inside the window. In plain English, as you would type it:
Buy XRPUSDT on the daily chart when the close crosses above the DEMA (period 20). Sell when the close crosses below the DEMA (period 20). Test from August 1, 2021 to August 1, 2026 with $10,000, 100% of equity per trade and a 0.1% fee.
On 3 March 2025, XRP fell 18.79% close to close on Binance's XRPUSDT daily candles (UTC), from 2.9396 to 2.3873, with a low of 2.2976. That is the largest one day fall in the test window during which this rule held a trade.
The rule had bought at the close of 2 March 2025, a day on which XRP opened at 2.1917 and closed at 2.9396. The exit signal, a close below the DEMA line, came only on the close of 7 March 2025. Here are the two order rows from the rule's trade log:
| Order row | Side | Order date (UTC) | Price | Size (USDT) | Fee | Net PnL |
|---|---|---|---|---|---|---|
| 233 | Entry | 2025-03-02 | 2.9396 | $12,777.44 | $12.78 | n/a (entry row) |
| 234 | Exit | 2025-03-07 | 2.3856 | $10,369.39 | $10.37 | -$2,431.20 |
That one trade lost $2,431.20 after fees, the worst trade of the five year run. The log records two orders at daily closes and nothing else: not the path inside 3 March, not the low of 2.2976 and not any liquidation.

Over the full window the rule made 162 trades and lost 21.23%, with a Max Drawdown of 75.91%. On the Performance tab, the results card shows a QUALITY of 30 next to its "Outperforms" box.
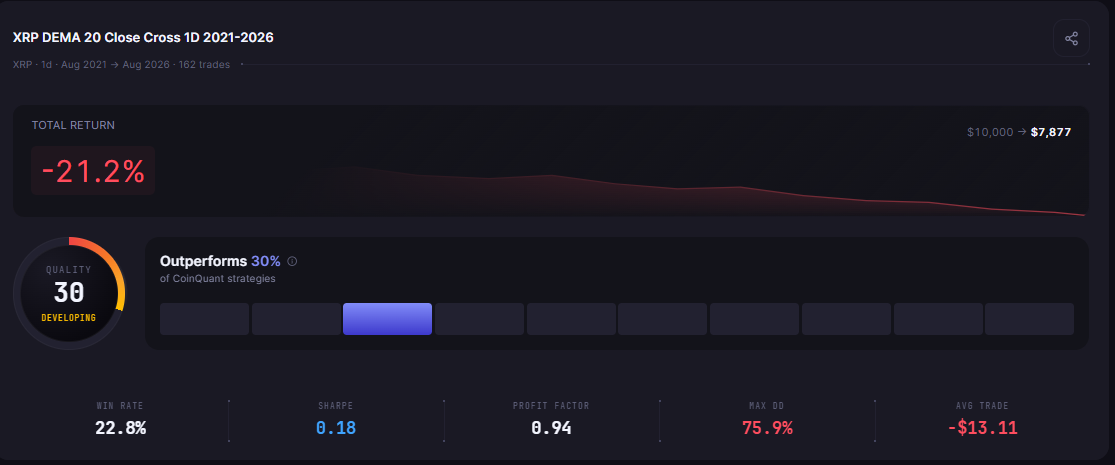
Data note: CoinQuant's XRPUSDT daily data has a gap from 9 to 15 September 2021 that the platform does not flag. No trade of this rule spans it: one exits on 7 September 2021 and the next enters on 30 September 2021.
Checks Before Trusting a Result Through a Cascade
- Signals: this rule acts only on daily closes, so it can never exit inside the day. The order dates in the trade log show exactly which closes it used.
- Costs: the test charges 0.1% on every entry and exit. No slippage was modelled, so real fills in a cascade could land worse than the close.
- Leverage: the test is spot and long only, with no leverage, so nothing in it can be liquidated. A leveraged copy of the same trade could have been closed out at a price the backtest never shows.
- Worst days: list the largest one day falls in the window and check whether a trade was open on each, as above for 3 March 2025.
- Worst trade and Max Drawdown: read them, not only the total. Here the worst trade was -$2,431.20 and the Max Drawdown 75.91%. See how to read Max Drawdown in crypto trading.
For when to buy back after a fall like this, see crypto market crash recovery after a major drop.
The Practical Lesson
- A candle hides the path: the 29 October 2026 BTCUSDT candle shows a 4.12% close to close fall, not the evening hour that carried the heaviest forced selling.
- A backtest on closes records closes: the XRP rule's log shows an entry on 2 March 2025 and an exit on 7 March 2025, for a net -$2,431.20 after fees.
- A spot test does not model liquidation: no leverage means no forced close. Fees are included and no slippage was modelled.
If your rule trades on closes, check what it did on the worst days in its trade log before you trust the total. In CoinQuant, an AI trading platform, you describe the rule in plain English with no coding required, then read its Trades tab order by order.
Build trading strategies on real data. No coding required.
Frequently Asked Questions
What is a liquidation cascade in crypto?
It is a chain of forced closes: falling prices liquidate leveraged positions, the forced selling pushes prices lower and that triggers more liquidations. On 29 October 2026, the counts ran from about $1 billion to $1.5 billion, depending on the source and the window.
What causes a long liquidation cascade?
Many leveraged long positions with liquidation levels close together. A fall through the first levels forces sales that push price into the next ones. MarginPad counted longs as 85% of the $985.7M liquidated on 29 October 2026 (UTC day).
Does a backtest include liquidations?
Not a spot backtest like this one. XRP DEMA 20 Close Cross 1D 2021-2026 is spot, long only and unleveraged, so no position can be liquidated. It records its orders at daily closes, with fees included and no slippage modelled.
Pull up your own rule's trade log and check what it did on the worst days.
Disclaimer:
Key Takeaway