Crypto Market Crash Recovery: How to Know When to Re-Enter After a Major Drop
.png)
The hardest trading decision during a crypto market crash is not the exit. Most traders exit late or not at all, but the psychological pressure to act is clear. The harder decision is the crypto re-entry strategy after crash conditions: when is it actually safe to get back in, what signals indicate a genuine recovery versus a dead-cat bounce, and how do you build rules around a decision that feels entirely emotional in the moment? This guide covers how to think about re-entry structurally, what indicators matter, and how to test your approach before you need it.
Why Re-Entry Is Harder Than It Looks
A market crash creates a specific psychological trap. After a 40% decline, the asset looks cheap. After a 60% decline, many traders who could have bought near the bottom instead wait for certainty that the bottom is in, at which point the asset has already recovered significantly.
The problem is that recovery begins before it feels safe to enter. Signals that confirm a recovery (price strength, volume, improving sentiment) appear well into the move, not at the start. Traders who wait for certainty systematically miss the early phase.
The solution is not to predict bottoms. It is to define rule-based conditions that indicate the probability of recovery is rising, and to enter based on those conditions rather than on intuition.
What Signals Actually Indicate a Crypto Recovery
Not all signals that appear during a crash recovery are equally reliable. The following are the most useful evidence-based signals for identifying a shift from capitulation to recovery:
RSI Recovering from Extreme Oversold Levels
When RSI drops below 25-30 on the daily chart during a crash, it indicates the selling has been extreme. The signal for re-entry is not the oversold reading itself: it is RSI recovering back above the threshold. A close below 30 followed by a close above 30 on the next candle indicates the extreme selling pressure is easing.
This is a mean-reversion signal, not a trend-following one. It does not predict how far the recovery will go. It indicates that the capitulation phase may be passing.
EMA Structure Recovering
During a crash, shorter-term EMAs fall below longer-term ones. A 21-day EMA below the 55-day EMA indicates the short-term direction is down relative to the medium-term. When the shorter EMA begins crossing back above the longer one, it signals that medium-term momentum is shifting.
This signal appears later in the recovery cycle than RSI does. It is more reliable but slower: traders who wait for the EMA cross confirm will typically enter after significant upside has already occurred.
Volume Profile on Recovery Days
Genuine recoveries tend to be accompanied by above-average volume on the days when price advances. If price is rising on declining volume, the recovery lacks broad participation and is more likely to be a short-covering bounce or low-conviction move.
CoinQuant's multi-indicator strategy builder supports volume conditions. A strategy that requires both a price signal and a volume confirmation condition can be backtested to see whether the additional filter improves or reduces performance.
A Plain-English Re-Entry Strategy Example
Here is a re-entry approach you could describe directly to CoinQuant's AI strategy builder:
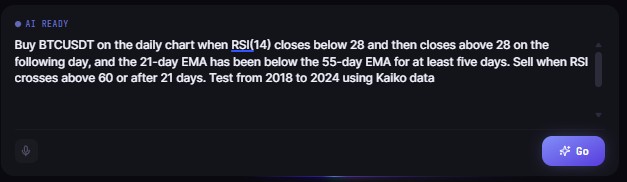
"Buy BTCUSDT on the daily chart when RSI(14) closes below 28 and then closes above 28 on the following day, and the 21-day EMA has been below the 55-day EMA for at least five days. Sell when RSI crosses above 60 or after 21 days. Test from 2018 to 2024 using Kaiko data."
This strategy captures post-crash recoveries (RSI coming out of extreme oversold territory) while requiring that the context is actually a crash recovery (21-day EMA below 55-day EMA for at least five days confirms the asset has been in a sustained downtrend, not just a minor pullback).
The exit is defined: either RSI signals the initial recovery has run its course, or the trade times out after three weeks if the recovery does not materialize.
How to Backtest a Re-Entry Strategy Properly
Running a re-entry strategy backtest on a short window will not show you what you need to know. Re-entry setups occur relatively rarely: major crash events happen a few times per market cycle. To get a meaningful sample of how your strategy handles these events, you need a historical window long enough to include multiple crash-and-recovery cycles.
For Bitcoin, Kaiko data from 2017 gives access to at minimum four major crash events:
The 2018 bear market (-84% peak to trough)
The March 2020 COVID crash (-50% in days)
The mid-2021 correction (-54%)
The 2022 bear market (-77%)
A re-entry strategy that holds up across all four events has been tested against fundamentally different crash types: a grinding bear, a sudden exogenous shock, a mid-cycle correction, and a cycle peak reversal. That is a more robust test than a single-event backtest.
When reading the results, the most important metrics for re-entry strategies are Max Drawdown (are you entering too early into continued declines?), Win Rate (does the strategy correctly identify recoveries more often than false starts?), and Profit Factor (are the wins large enough relative to the losses to justify the risk?).
Common Mistakes in Re-Entry After a Crypto Crash
Entering on the first bounce. The first bounce after a crash low is often a dead-cat bounce: a temporary relief rally driven by short covering and bargain hunting that reverses quickly. The better signal is not the first bounce but RSI recovering from extreme oversold territory on a candle with follow-through.
Using too wide a stop-loss that you cannot hold. A theoretically correct re-entry strategy is useless if the required holding period during a drawdown exceeds what you can psychologically tolerate. If your backtest shows a max drawdown of 25% during the recovery period and you know you will exit at 15%, the backtest result is not achievable in practice.
Ignoring the broader market context. Bitcoin re-entry signals during a crypto-wide bear market carry different implications than Bitcoin re-entry signals during an isolated BTC correction. Running your re-entry backtest on multiple assets (not just BTC) reveals whether the strategy is asset-specific or broadly applicable.
Expecting precision. Re-entry strategies do not identify the exact bottom. They identify the zone where the probability of recovery exceeds the probability of continued decline. The goal is not to buy the lowest tick: it is to enter in a risk-controlled way during the recovery phase.
Disclaimer:
This content is for educational and informational purposes only and does not constitute financial, investment, or trading advice. All strategies and examples are for illustrative purposes and do not guarantee results. Always conduct your own research before making financial decisions.
Key Takeaway