
Trend or Chop? Testing a Vertical Horizontal Filter Gate on a Solana Moving Average Rule (2021-2026)
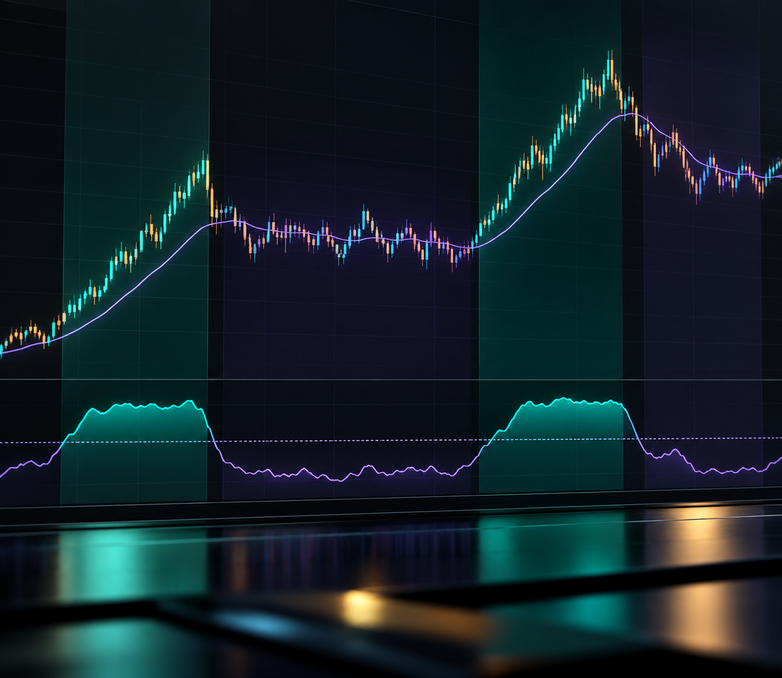
A vertical horizontal filter strategy only lets a trend rule trade when the market is actually trending. We tested one on Solana: a 20-day EMA cross that may enter only while the Vertical Horizontal Filter (VHF) reads above 0.35. From August 2021 to August 2026 it returned 186.76% after fees, against 170.31% for the same EMA rule without the gate and 110.02% for holding SOL.
The honest context matters more than the headline. The gated rule made only 23 trades, so its results card says "Statistically inconclusive". One trade made $41,445.81, more than twice its whole net profit. And the 89 trades the gate skipped were not a losing group: inside the ungated rule they netted +$15,442.94.
The author built both rules in CoinQuant, an AI trading platform, then ran every backtest there with the same coin, window, capital and 0.1% fee. No tuned parameters, no cherry picked dates.
What the Vertical Horizontal Filter Measures
CoinQuant's Supported Elements page puts it in one line: "VHF tells you whether the market is trending or just chopping sideways, so you know which kind of strategy to use." The indicator was created by Adam White.
The idea is simple. VHF divides the distance between the highest and lowest close over the period by the sum of every move from one close to the next:
- High reading: price travelled far in one direction with little back and forth, so the market is trending.
- Low reading: price moved a lot but went nowhere, so the market is chopping sideways.
- No direction: VHF says whether a trend exists, not which way it points. It needs a directional rule beside it.
The same page gives two levels. It lists 0.5 as the key trend threshold, with a default period of 28, and its advanced example says to allow moving average crossover entries above 0.5 and, "when it drops below 0.35, disable trend entries".
Our gate uses that 0.35 level. We did not search for a better number.
The Rules: A 20-Day EMA Cross, With and Without the VHF Gate
Both strategies trade SOLUSDT on daily bars, long only, one position at a time. The only difference is the extra entry condition.
- Base rule entry: buy when the daily close crosses above the 20-day EMA.
- Gated rule entry: the same cross, but only while VHF(28) is greater than 0.35.
- Exit (both): sell when the daily close crosses below the 20-day EMA. No stops, no targets, no other filters.
| Parameter | Gated rule | Base rule |
|---|---|---|
| Strategy | SOL EMA 20 Cross + VHF 28 Gate 1D 2021-2026 | SOL EMA 20 Close Cross 1D 2021-2026 |
| Instrument | SOLUSDT (spot, Binance) | SOLUSDT (spot, Binance) |
| Data source | Kaiko via CoinQuant | Kaiko via CoinQuant |
| Timeframe | Daily (1D) | Daily (1D) |
| Tested window | 2021-08-01 to 2026-08-01 | 2021-08-01 to 2026-08-01 |
| First trade to last exit | 2021-09-22 to 2026-06-27 | 2021-09-22 to 2026-07-27 |
| Entry | Close crosses above EMA(20) and VHF(28) is above 0.35 | Close crosses above EMA(20) |
| Exit | Close crosses below EMA(20) | Close crosses below EMA(20) |
| Direction | Long only, no leverage | Long only, no leverage |
| Initial capital | $10,000 | $10,000 |
| Position size | 100% of equity per entry | 100% of equity per entry |
| Fees | 0.1% on entry and 0.1% on exit (no slippage set) | 0.1% on entry and 0.1% on exit (no slippage set) |
| Baselines (same window) | SOL Buy and Hold 1D 2021-2026, BTC Buy and Hold 1D 2021-2026 | SOL Buy and Hold 1D 2021-2026, BTC Buy and Hold 1D 2021-2026 |
On the Strategy tab, the gated rule reads in plain words, with the entry listed above the exit. No coding required: the VHF condition is one more line in the entry.
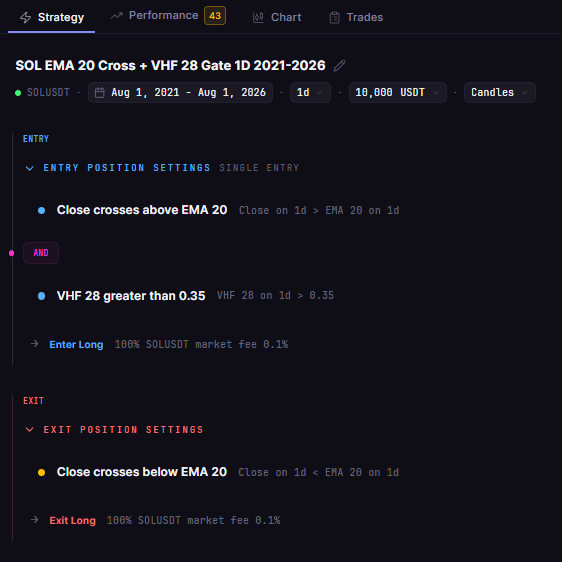
SOL EMA 20 Cross + VHF 28 Gate 1D 2021-2026 in CoinQuant: enter when the daily close crosses above the 20-day EMA while VHF(28) is above 0.35, exit when the close crosses back below the EMA.
Five-Year Results of the Vertical Horizontal Filter Strategy on Solana
The gate cut the trade count from 112 to 23 and finished ahead of the base rule on Total Return, Max Drawdown, Profit Factor and Sharpe Ratio.
| Metric | Gated rule | Base rule | SOL buy and hold | BTC Spot Comparison |
|---|---|---|---|---|
| Strategy | SOL EMA 20 Cross + VHF 28 Gate 1D 2021-2026 | SOL EMA 20 Close Cross 1D 2021-2026 | SOL Buy and Hold 1D 2021-2026 | BTC Buy and Hold 1D 2021-2026 |
| Total Return | 186.76% | 170.31% | 110.02% | 57.33% |
| Final Balance | $28,676.25 | $27,031.04 | $21,002.12 | $15,733.43 |
| Total Trades | 23 | 112 | 1 | 1 |
| Win Rate | 13.04% (3W / 20L) | 23.21% (26W / 86L) | n/a (single hold) | n/a (single hold) |
| Profit Factor | 1.60 | 1.19 | n/a (single hold) | n/a (single hold) |
| Sharpe Ratio | 0.72 | 0.62 | 0.64 | 0.44 |
| Max Drawdown | 58.90% | 63.30% | 96.27% | 76.63% |
| CAGR | 23.44% | 21.99% | 15.99% | 9.48% |
| Time in Market | 10.78% | 44.39% | 100.0% | 100.0% |
| Total Fees | $1,100.83 | $5,233.47 | $31.01 | $25.74 |
All four runs share the same window, $10,000 starting capital, 100% sizing and 0.1% fee, so the rows compare like with like. CAGR is the steady yearly growth rate that would turn $10,000 into each final balance over the five years.
The gated rule spent only 10.78% of the window in a trade and paid $1,100.83 in fees, against $5,233.47 for the base rule. With three winners and 20 losers, the result rests on how large the three winners were.
On the Performance tab, the results card marks this run "Statistically inconclusive": 23 trades, and it needs 50+ to rate. Treat every figure for the gated rule as one observation, not a proven edge.
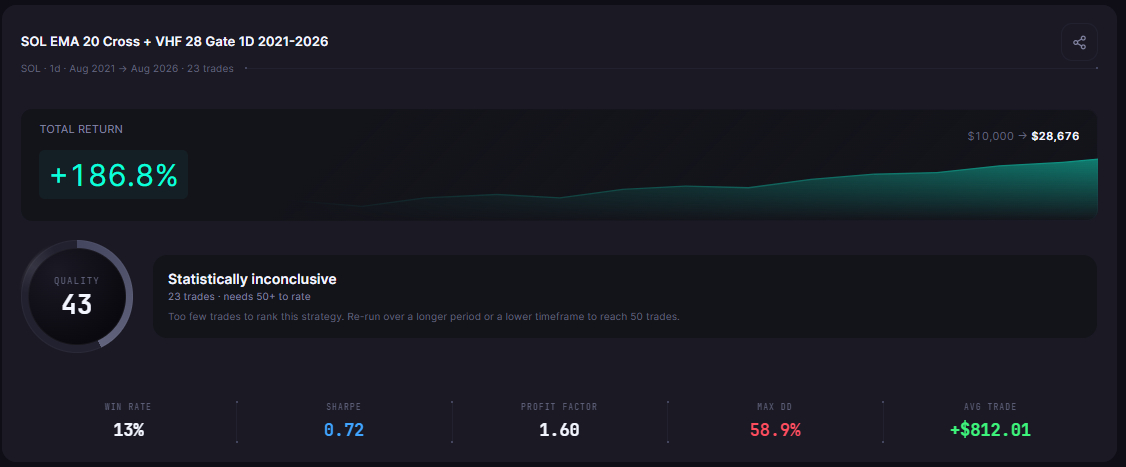
SOL EMA 20 Cross + VHF 28 Gate 1D 2021-2026 results card on the CoinQuant Performance tab: daily SOL, Aug 2021 to Aug 2026, 23 trades, +186.8%, $10,000 to $28,676, marked "Statistically inconclusive".
Buy and Hold Comparison: SOL Held on the Same Window and Fee
Holding SOL for the full five years returned 110.02%, but it went through a 96.27% Max Drawdown on the way. The gated rule finished higher at 186.76% with a shallower 58.90% drawdown, and it was in a trade only 10.78% of the time.
The platform's own Buy and Hold benchmark carries no fees and ends at 110.44%, so the table uses the SOL Buy and Hold 1D 2021-2026 strategy (110.02%), which pays the 0.1% fee on entry and exit.
For a wider view, BTC Buy and Hold 1D 2021-2026 returned 57.33% over the same dates, with a 76.63% Max Drawdown. Both baselines are single holds, so their Win Rate and Profit Factor are not meaningful.
The Trades the Gate Skipped
The gate did not pick the base rule's winners and drop its losers. The 23 gated trades match 23 base trades on entry and exit date; the gate simply skipped the other 89 entries.
| Group of trades | Trades | Winners / losers | Net after fees |
|---|---|---|---|
| Skipped by the gate (inside the base rule) | 89 | 23 / 66 | +$15,442.94 |
| Kept by the gate (inside the base rule) | 23 | 3 / 20 | +$1,588.11 |
| Kept by the gate (gated rule's own run) | 23 | 3 / 20 | +$18,676.25 |
Each run compounds on its own balance, so the same 23 trades made far more dollars in the gated run.
The largest of them ran from 13 October 2023 to 6 January 2024. It returned 328.82% after fees in both runs: $41,445.81 in the gated run and $22,838.84 in the base run. The worst gated trade lost 20.64% after fees, or $8,200.48, from 2 to 3 March 2025. The median gated trade lost $628.01.
So in this test the gate mainly changed when the rule had money in the market; it did not pick out the base rule's best trades. For more on why crossovers lose money in sideways markets, see how to measure false crossover signals in a crypto backtest.
What This Test Cannot Tell You
This is one test with clear limits:
- One coin and one window: SOLUSDT, daily bars, 2021-08-01 to 2026-08-01.
- One threshold: 0.35 comes from CoinQuant's docs. A different threshold or period could give a different answer, and we did not test others.
- A small sample: 23 trades, with most of the profit in one trade.
- Costs: a 0.1% fee on entry and exit; no slippage was set.
Our efficiency ratio backtest on Ethereum tried Kaufman's filter, and this sideways market test shows how trend rules behave without one.
The Practical Lesson
- A choppy market filter changes exposure first: the gated rule was in a trade for 10.78% of the window, against 44.39% for the base rule.
- It is not a loser filter: the 89 skipped trades netted +$15,442.94 inside the base rule.
- Check the trade count before the return: 23 trades is "Statistically inconclusive", and one trade carried the result.
- Test the threshold, do not trust it: run the same rule with other VHF levels and on other coins before you rely on 0.35.
In CoinQuant you can add a VHF condition to an entry in plain English and backtest it on historical data. Try the same gate on BTC or ETH next.
Build trading strategies on real data. No coding required.
Frequently Asked Questions
What is the Vertical Horizontal Filter?
The Vertical Horizontal Filter measures whether a market is trending or chopping sideways. A high reading means price moved far in one direction with little back and forth. It gives no direction on its own.
How do you filter choppy markets in a trend strategy?
One way is to add a trend strength condition to the entry, such as VHF(28) above 0.35, so the trend rule only enters when the market is trending. In this Solana test, that cut the trade count from 112 to 23.
Does a trend filter improve a moving average crossover?
In this one test, the gated EMA rule returned 186.76% against 170.31% without the gate, with a lower Max Drawdown. But it made only 23 trades and its results card says "Statistically inconclusive". The skipped trades were also profitable overall. One test cannot settle it.
Test the VHF gate on Solana with your own threshold and dates.
Run this Solana VHF backtest on CoinQuant (https://app.coinquant.ai/?ref=NSfBKvpv)
Disclaimer:
Key Takeaway