
Efficiency Ratio Strategy Backtest on Ethereum: Testing Kaufman's Trend Filter

Most trend tools try to answer one question: is price going up or down? Perry Kaufman's Efficiency Ratio asks a better one: is price going anywhere at all? A market that travels 40% to net 2% movement is grinding sideways, and that is where trend entries go to die. An efficiency ratio trading strategy uses Kaufman's ratio to stand aside in exactly those conditions.
The Efficiency Ratio, or ER, was built to measure exactly that. It compares how far price moved over a period with how much distance it covered getting there, and returns a number between 0 and 1. High values mean movement was efficient, in a straight line. Low values mean churn.
This article puts the filter to work on daily Ethereum from August 2021 to August 2026, gating entries on a simple trend trigger, and measures whether it kept the strategy out of rangebound chop better than simply owning Ether.
What the Efficiency Ratio Trading Strategy Actually Does
The ER is defined in one line of arithmetic: net price change over the last 20 bars, divided by the sum of the absolute bar-to-bar changes over the same window. If price walks $100 up in a clean line, the ratio approaches 1. If it finishes flat after swinging $500 back and forth, the ratio collapses toward 0.
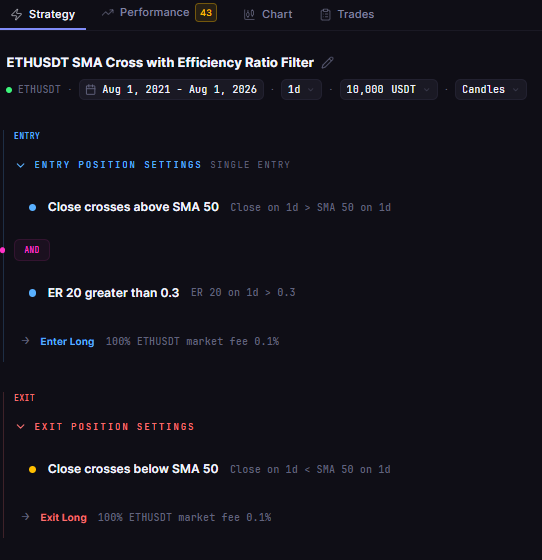
Kaufman's convention treats readings above 0.30 as a trending regime. A common implementation, and the one tested here, uses the ratio as a gate on a standard trend trigger:
- Entry group, both conditions required: close crosses above the 50-period Simple Moving Average, and the Efficiency Ratio (period 20) is above 0.30 at the trigger
- Exit: close crosses below the 50-period Simple Moving Average
Long only, one position at a time, no leverage, on ETHUSDT daily. The benchmark is the honest one: would the results have been better simply holding Ether through the whole window?
Test Setup
| Parameter | Setting |
|---|---|
| Strategy | ETH Efficiency Ratio Trend Filter 1D 2021-2026 |
| Instrument | ETHUSDT (spot, Binance) |
| Timeframe | Daily (1D) |
| Tested window | 2021-08-01 to 2026-08-01 |
| Entry trigger | Close crosses above SMA(50) |
| Entry filter | Efficiency Ratio (20) above 0.30 |
| Exit | Close crosses below SMA(50) |
| Direction | Long only, no leverage |
| Initial capital | $10,000 |
| Position size | 100% of equity per entry |
| Fees | 0.1% taker, modeled |
| Data source | Kaiko via CoinQuant |
| Baseline | ETH Buy and Hold 1D 2021-2026 (same window) |
The Backtest Results
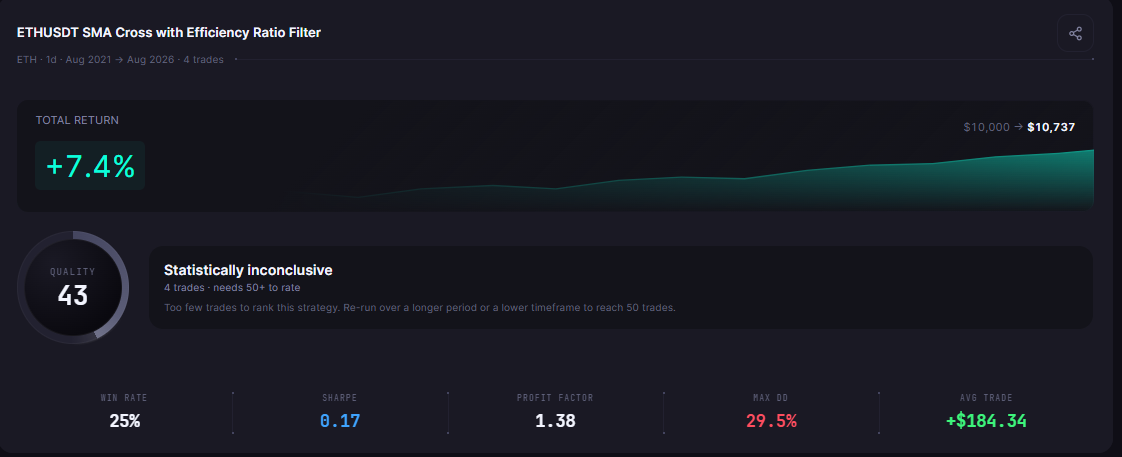
The filtered strategy turned $10,000 into $10,737.35, a +7.37% return from four trades, while Ether fell 27.95% over the same window.
| Metric | Strategy | Buy and Hold |
|---|---|---|
| Total Return | +7.37% | -27.95% |
| Final Balance | $10,737.35 | $7,205.03 |
| Total Trades | 4 | 1 |
| Win Rate | 25.0% (1W / 3L) | n/a (single hold) |
| Profit Factor | 1.38 | n/a |
| Sharpe Ratio | 0.17 | 0.26 |
| Sortino Ratio | 0.28 | 0.37 |
| Max Drawdown | 29.50% | 79.30% |
| Average Win | $2,690.51 | n/a |
| Average Loss | $651.05 | n/a |
| Best Trade | +$2,690.51 | n/a |
| Worst Trade | -$934.27 | n/a |
| Time in Market | 7.01% | 100% |
| Total Fees | $72.22 | $17.20 |
| CAGR | +1.43% | -6.34% |
What the Data Shows
The first finding is that the filter did its stated job. The strategy finished +7.37% while holding lost 27.95%, and it did so with a maximum drawdown of 29.50% against 79.30% for holding, spending just 7.01% of days in the market. As a chop-avoidance machine on a declining asset, the gate earned its keep.
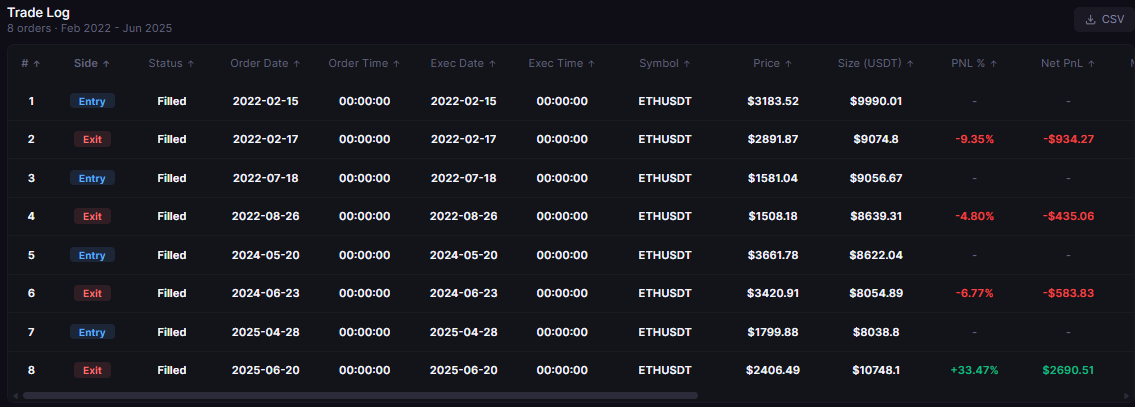
The second finding is how extreme the selectivity was. Four qualifying entries in five years: three were false starts (February 2022 at -$934.27, July 2022 at -$435.06, May 2024 at -$583.83) and one was a clean catch, the April to June 2025 advance for +$2,690.51. The single winner carried the whole test, which is exactly why the profit factor reads 1.38 despite a 25.0% win rate.
The third finding is the small-sample warning, stated plainly. Four trades is a thin basis for any conclusion. One flipped trade would change the headline, and the difference between this result and a losing one is one regime call in the spring of 2025. Readers judging the filter should weigh the mechanism, not the four data points: the gate only opens when price is above its 50-day average and traveling efficiently, and over these five years that combination was rare.
The fourth finding is the year ledger. Two small losses in 2022 (-$1,369.33 combined), one in 2024 (-$583.83), and the 2025 win (+$2,690.51). The strategy did nothing in 2021, 2023, and 2026, which in a filtered design is not a bug. It is the filter declining to trade.
What a Filter Can and Cannot Do
The framing matters for how to read everything above. A filter does not create signal; it decides when an existing signal is allowed to act. The base setup here, a close crossing its 50-day average, fires often and mostly badly on Ether's choppy tape. The ER gate throws away most of those crossings and keeps the ones where price was actually going somewhere. That is why time in market collapsed to 7.01% while the return stayed positive.
The trade-off is visible too. With the gate this tight, the strategy also sits out most recoveries until efficiency improves, and on a market that spends long stretches deciding what it thinks, sitting out is the point. The cost of avoiding chop is missing early trend. On this window the exchange was favorable, but not dramatically so: the Sharpe ratio of 0.17 is modest in absolute terms, and the entire result fit inside one strong trade.
The realistic takeaway for a trend trader evaluating Kaufman's ratio is that it works well as a veto, not as a vote. Let it stop you from buying chop, do not let it pick your entries alone, and size your expectations to the number of trades it permits.
The Practical Lesson
- The ER-gated trend strategy returned +7.37% on daily ETH over five years versus -27.95% for holding, with a 29.50% drawdown against 79.30%
- The filter was extremely selective: four trades in five years, with one winner (+$2,690.51) carrying the result
- Four trades is a small sample; the durable output of this test is the mechanism, not the headline number
- Pair the Efficiency Ratio with a trend trigger you already trust and let it veto low-quality entries, rather than hunting for an entry signal inside it
Kaufman's ratio is one of the cleaner ways to answer the question every trend trader should ask before buying: is the market moving, or just making noise? Five years of Ethereum data show the filter takes that question seriously, almost to a fault.
Run this efficiency ratio backtest yourself and test your own filter settings on CoinQuant. Backtest trend strategies free on CoinQuant
Disclaimer:
Key Takeaway
