
Two Years or Five? The Same Bitcoin 4h Rule Tested on Both Windows (2021-2026)

A two year vs five year backtest of one Bitcoin 4h rule gives two different stories. On the last two years alone, a simple Adaptive Moving Average rule lost 43.43%. Run on five years with identical settings, the same rule lost 79.54% across 604 trades, while holding Bitcoin over that span returned 57.33%.
The shorter window did not flip the verdict: the rule lost money and trailed Buy and Hold on both. What it hid was the size of the damage. The five year run's Max Drawdown reached 82.73%, against 61.68% on two years, and most of the extra loss came in one year the short window never saw: 2022.
The author ran both backtests on CoinQuant with the same rule, fee, capital and sizing, changing only the start date. This article reports the results without adjustment. No tuned parameters, no cherry picked dates.
Two Year vs Five Year Backtest: Why Window Length Matters
A backtest window is the stretch of history the test runs on. A window that starts in August 2024 skips all of 2022, the year Bitcoin spent mostly falling, so any rule tested on it never meets a long bear market.
Short windows are common, partly because some tools load a limited number of bars. As of 29 October 2026, TradingView's pricing page lists 5K historical bars for Basic, the entry level in its plans table. On 4h data, 5,000 bars cover about 833 days, roughly 2.28 years: enough for a two year window, not for five. For the steps of a TradingView test, see how to backtest on TradingView.
The window sizes in this test, counted as days times six 4h bars a day:
- Two year window: 2024-08-01 to 2026-08-01, 4,380 bars of 4h data
- Five year window: 2021-08-01 to 2026-08-01, 10,956 bars of 4h data
The Rule and the Settings
The rule is the simplest kind of trend filter. It buys Bitcoin when the 4h close crosses above its 20 period Adaptive Moving Average (AMA) and sells when the close crosses back below it. CoinQuant's Supported Elements page describes AMA as "a self-adjusting moving average that moves fast in clean trends and slows down in choppy markets to cut out noise."
The two runs are separate strategies in the author's library. They share every setting except the start date.
| Parameter | Setting |
|---|---|
| Strategy | BTC AMA 20 Close Cross 4H 2021-2026; BTC AMA 20 Close Cross 4H 2024-2026 |
| Instrument | BTCUSDT (spot, Binance) |
| Data source | Kaiko via CoinQuant |
| Timeframe | 4 hours (4h) |
| Tested windows | 2021-08-01 to 2026-08-01 (five years); 2024-08-01 to 2026-08-01 (two years) |
| Entry | Close crosses above AMA (period 20) |
| Exit | Close crosses below AMA (period 20) |
| Direction | Long only, no leverage, one position at a time |
| Initial capital | $10,000 |
| Position size | 100% of equity per entry |
| Fees | 0.1% on entry and 0.1% on exit (fees included, no slippage modelled) |
| Baselines (same windows) | BTC Buy and Hold 1D 2024-2026; BTC Buy and Hold 1D 2021-2026 |
The Buy and Hold baselines run on daily bars, buy on the first day of each window and pay the same 0.1% fee on entry and exit.
Two Years: Result and Buy and Hold Comparison
On the two year window, BTC AMA 20 Close Cross 4H 2024-2026 turned $10,000 into $5,657.22, a Total Return of -43.43% over 238 trades. Holding Bitcoin on the same window lost only 4.06%.
| Metric | AMA 20 rule, two years | BTC Spot Comparison |
|---|---|---|
| Strategy | BTC AMA 20 Close Cross 4H 2024-2026 | BTC Buy and Hold 1D 2024-2026 |
| Total Return | -43.43% | -4.06% |
| Final Balance | $5,657.22 | $9,593.61 |
| Total Trades | 238 | 1 |
| Win Rate | 18.07% (43W / 195L) | n/a (single hold) |
| Profit Factor | 0.81 | n/a (single hold) |
| Sharpe Ratio | -0.75 | 0.18 |
| Max Drawdown | 61.68% | 52.97% |
| Total Fees | $4,655.02 | $19.59 |
Both runs share the window, capital, sizing and 0.1% fee, so the rows compare like with like. The rule trailed Buy and Hold on Total Return and still had the deeper Max Drawdown, 61.68% against 52.97%.
Fees did much of the damage: $4,655.02 on 238 round trips, close to half the starting capital. With one trade, the Buy and Hold card shows its QUALITY number next to "Statistically inconclusive" (1 trade · needs 50+ to rate), so read it as a reference line, not a rated strategy.
The results card for the two year run shows the trade count, the loss and its QUALITY number of 20.
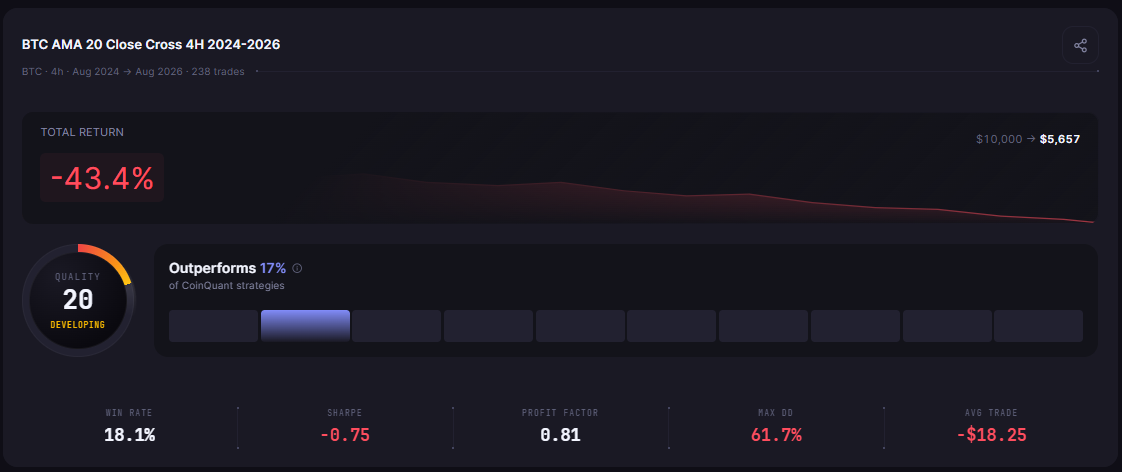
The same rule on the last two years only, 2024 to 2026: 238 trades, -43.4% Total Return, $10,000 to $5,657, QUALITY 20
Five Years: Result and Buy and Hold Comparison
On the five year window, BTC AMA 20 Close Cross 4H 2021-2026 turned $10,000 into $2,045.93, a Total Return of -79.54% over 604 trades. Holding Bitcoin over the same five years returned 57.33%.
| Metric | AMA 20 rule, five years | BTC Spot Comparison |
|---|---|---|
| Strategy | BTC AMA 20 Close Cross 4H 2021-2026 | BTC Buy and Hold 1D 2021-2026 |
| Total Return | -79.54% | 57.33% |
| Final Balance | $2,045.93 | $15,733.43 |
| Total Trades | 604 | 1 |
| Win Rate | 18.54% (112W / 492L) | n/a (single hold) |
| Profit Factor | 0.75 | n/a (single hold) |
| Sharpe Ratio | -0.66 | 0.44 |
| Max Drawdown | 82.73% | 76.63% |
| CAGR | -27.17% | 9.48% |
| Total Fees | $5,214.52 | $25.74 |
Both runs share the window, capital, sizing and 0.1% fee. CAGR is the steady yearly rate that would reach the same final balance over the window: -27.17% a year for the rule against 9.48% for holding.
The rule was in a position for 50.50% of the window, so it sat out about half of Bitcoin's moves and still fell further than the holder at the worst point. Its card shows a QUALITY number of 20 next to the "Outperforms" box, the same number as the two year card.
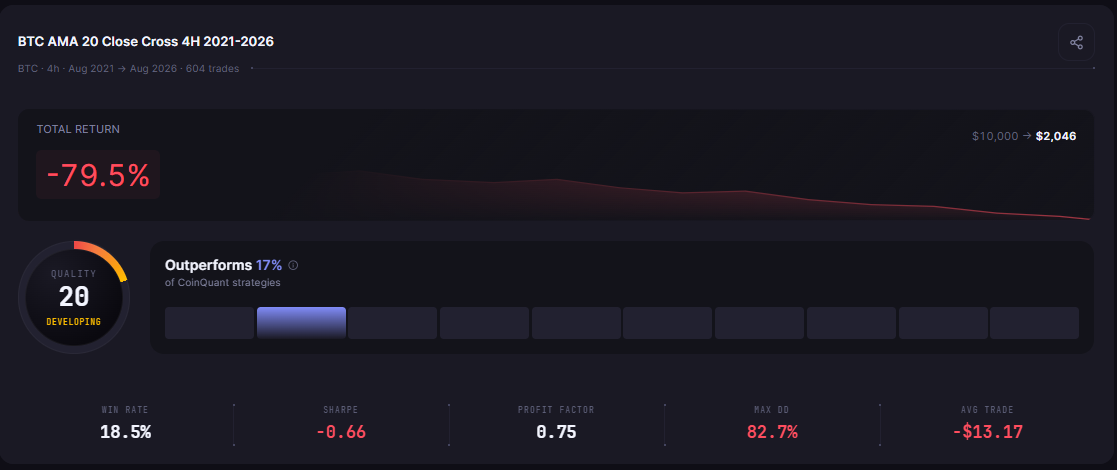
The same rule on five years of Bitcoin 4h data, 2021 to 2026: 604 trades, -79.5% Total Return, $10,000 to $2,046, QUALITY 20
What the Extra Three Years Added
To see where the extra loss came from, we grouped the five year run's trades by the UTC date of their exit order and added up each group's net result after fees. The 2021 row starts on 1 August 2021 and the 2026 row ends on 1 August 2026.
| Exit year (UTC) | Trades | Wins | Net after fees |
|---|---|---|---|
| 2021 (from 1 Aug) | 50 | 10 | -$2,084.49 |
| 2022 | 119 | 17 | -$5,129.41 |
| 2023 | 129 | 23 | $797.48 |
| 2024 | 109 | 30 | $1,233.52 |
| 2025 | 120 | 19 | -$1,888.38 |
| 2026 (to 1 Aug) | 77 | 13 | -$882.79 |
The six rows add up to -$7,954.07, the run's full loss from $10,000 to $2,045.93. Three things stand out:
- 2022: the worst year by far. Its 119 trades won only 14.29% of the time and lost $5,129.41 after fees, more than any other year.
- Good years: short ones. 2023 and 2024 were the only profitable exit years, and together they made back less than half of 2022's loss.
- The two year window: it starts after the damage. Its 238 trades are the same trades as the five year run's trades from 2024-08-01 on: entry dates and prices match, and 43 of them won in both runs.
Those shared trades lost $1,570.56 inside the five year run but $4,342.78 in the two year run. The trades are identical; the balance is not. By August 2024 the five year run had far less money left to compound, so compare the windows by percentage, not by dollar net.
What This Test Cannot Tell You
This is one rule, one coin and one timeframe. A different indicator, period or exit could treat 2022 very differently, and a rule built for falling markets might look better on five years than on two.
The comparison has limits worth stating:
- Costs: fees included, no slippage modelled. Each trade pays 0.1% on entry and 0.1% on exit.
- Direction: long only, one position, no leverage. The rule never shorts the falls it sits out.
- Bar sizes: the rule trades 4h bars; the Buy and Hold baselines use daily bars for the same windows.
- Past data: both windows end on 1 August 2026, and the results describe that history, not the future.
For how much history a backtest needs in general, see how much historical data you need for a reliable crypto backtest. For the trade count side of the same question, see how many trades a backtest needs before you can trust it.
The Practical Lesson
- A short window can hide the worst year: the two year test never met 2022, where this rule lost $5,129.41 after fees.
- Drawdown grows with history: 61.68% on two years, 82.73% on five.
- The verdict held on both windows: -43.43% against -4.06% on two years, -79.54% against 57.33% on five.
Before trusting a short backtest, run the same rule again on the longest window your data allows and compare the two cards. In CoinQuant, an AI trading platform, you describe the rule in plain English with no coding required, then set each test window yourself. For another five year Bitcoin test, see what one five year backtest can and cannot tell you about the four year cycle.
Build trading strategies on real data. No coding required.
Frequently Asked Questions
Is a two-year backtest long enough?
It can be, but only if those two years include the kind of market you expect to meet. Here, the two year window left out 2022, the rule's worst year, and showed a Max Drawdown of 61.68% where five years showed 82.73%.
Why did the five-year result differ from the two-year one?
The five year window adds August 2021 to July 2024, which includes the 2022 bear market. The rule's trades that closed in 2022 lost $5,129.41 after fees, so the longer test ended at -79.54% against -43.43%.
How many bars is two years of 4h data?
Six 4h bars a day for 730 days gives 4,380 bars for 2024-08-01 to 2026-08-01. The five year window in this test holds 10,956 bars.
Test the same rule on a short and a long window and see whether your verdict changes.
Disclaimer:
Key Takeaway