
How to Backtest on TradingView in 2026: Strategy Tester Steps, Settings, and Blind Spots
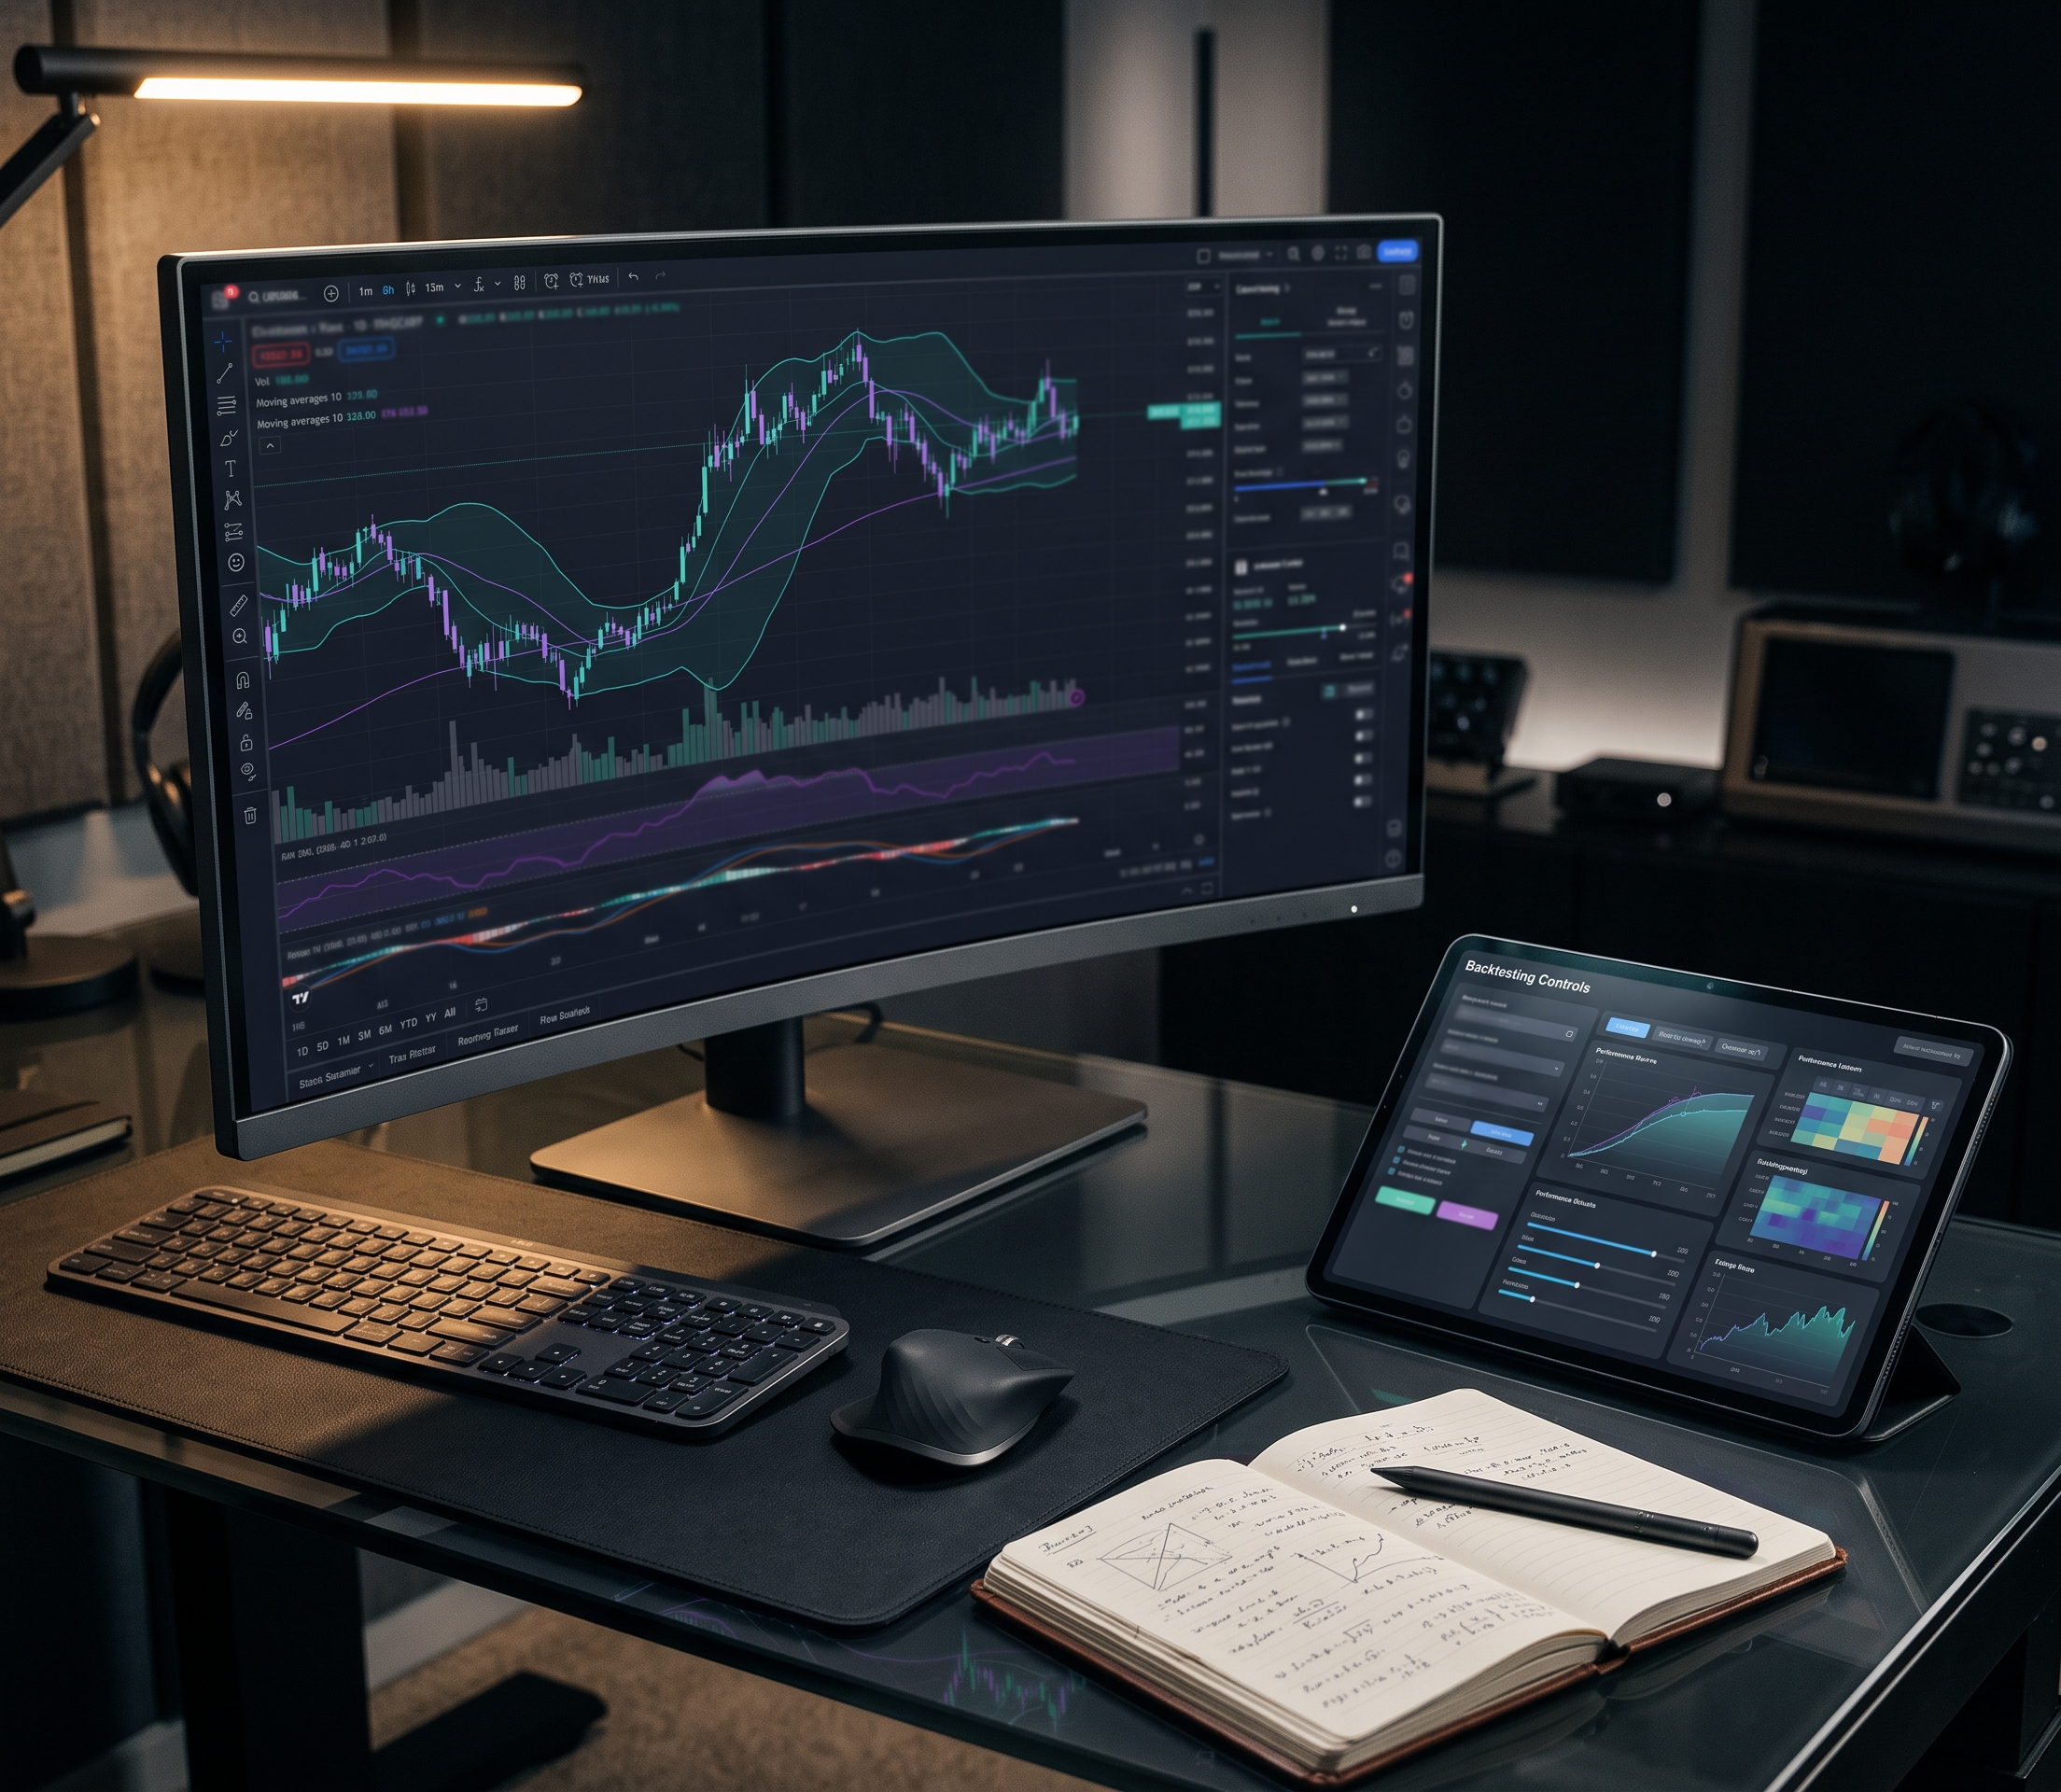
TradingView backtests run on strategies: Pine Script programs that place simulated orders on your chart. You add one to a chart and TradingView replays it over the chart's history. A Strategy Report then shows the metrics and every trade.
This guide covers how to backtest on TradingView step by step, the settings that quietly change the result and the blind spots to check before you trust any number. Every TradingView detail below comes from its own help pages, fetched September 30, 2026. The last section shows the same kind of rule tested without Pine Script, using a real strategy from our Strategy Library.
How to Backtest on TradingView, Step by Step
Each step is one action. Do them in order, because the later steps change what the earlier ones report.
Choose or write a strategy. Use a built-in or Community strategy, or write your own in Pine Script. A strategy script is declared with strategy() and places orders with strategy.entry and strategy.exit, according to TradingView's strategies help page.
Add it to your chart. The Strategy Report tab opens with a Metrics section and a List of Trades, and simulated orders appear on the chart as arrows.
Set the Properties before you read anything. Capital, order size, commission and slippage all change the result (next section).
Change one parameter at a time. TradingView states that changing a strategy's parameters changes its backtest and forward-test results, so isolate each change.
Extend the history if you need it. Deep Backtesting runs the strategy on all available history for a date range you choose, up to two million bars. TradingView notes its results may differ from the regular report.
Read the List of Trades, not just the Metrics. A good headline number can hide one lucky trade or a long run of small losses.
Settings That Change Your Result
TradingView's Strategy Properties page lists the settings below. Treat them as part of the strategy, because the same Pine Script with different Properties is a different test.
| Setting | What it controls | Why it matters |
|---|---|---|
| Initial Capital | Starting balance (the help page gives a default of 1,000,000) | Set it to a realistic account size, or position sizes and fees will not reflect your trading |
| Order Size | Fixed quantity, cash amount or % of equity | % of equity compounds; a fixed size does not |
| Pyramiding | How many entries can stack in the same direction | More entries means more exposure than the rule suggests |
| Commission | Percentage, per contract or per order, "applied on both entries and exits" | Every round trip pays twice; frequent strategies feel this most |
| Slippage | Extra ticks against you on each fill, usable to account for the spread | Fills at the exact bar price are rarely realistic |
| Recalculate | After an order fills, or on every tick | TradingView notes that on-every-tick strategies repaint |
| Fill orders | By default, orders are created on bar close and filled at the next bar's open; a bar magnifier option also exists | The fill assumption decides the entry price of every trade |
The page also covers Base Currency, Margin and Verify Price For Limit Orders. Which plans include Deep Backtesting or the bar magnifier is not covered here, so check your own account.
Blind Spots to Check Before You Trust It
These are common mistakes in any backtest, on TradingView or anywhere else:
Costs left out. Check that Commission and Slippage match what you actually pay. A strategy that trades often can lose its whole edge to fees.
Repainting. TradingView's Pine Script docs on repainting estimate that more than 95% of indicators repaint in some form. A signal that changes after the bar closes produces a history you could never have traded.
Tuning until it looks good. Because results move with every parameter, you can always find a setting that fits the past. Test the chosen setting on a window you did not tune on.
Too few trades. A report built on a handful of trades is an anecdote. Count the trades before reading the win rate.
No benchmark. Compare the result with simply holding the asset over the same window. A strategy that trails buy and hold with a similar drawdown has not earned its complexity.
Unrealistic sizing. Order size, capital and pyramiding together decide how much is at risk per trade. Make sure they describe an account you could run.
Testing the Same Idea Without Pine Script
TradingView needs the rule written as code. On CoinQuant, an AI trading platform, you type the rule in plain English instead: no coding required, no Python and no Pine Script. Here is a classic crossover exactly as you would type it:
Buy BTCUSDT on the daily timeframe when the 20-period EMA crosses above the 50-period EMA. Sell when the 20-period EMA crosses below the 50-period EMA. Start with $10,000, use 100% of equity, hold one position at a time and apply a 0.1% taker fee. Test from January 1, 2021 to August 1, 2026.
CoinQuant turns that into editable rule blocks, and our Strategy Library holds this exact strategy as BTC EMA Crossover 20/50 1D 2021-2026. The TradingView settings above map across like this:
| TradingView Properties | CoinQuant equivalent |
|---|---|
| Strategy | BTC EMA Crossover 20/50 1D 2021-2026 |
| Initial Capital | $10,000 initial capital |
| Order Size | Position size as a % of equity or a fixed USDT amount; here 100% of equity |
| Pyramiding | This strategy holds one position at a time |
| Commission | Maker and taker fees at order level; here a 0.1% taker fee on market orders |
| Slippage | None set in this strategy, so results are fee-inclusive with zero slippage |
| Strategy Report and List of Trades | Results panel and trade log; Download Data exports metrics and trade logs |
The data is BTCUSDT spot from Binance, supplied by Kaiko via CoinQuant. Order-level maker and taker fees arrived in the CoinQuant changelog on January 26, 2026. The FAQ documents Download Data.
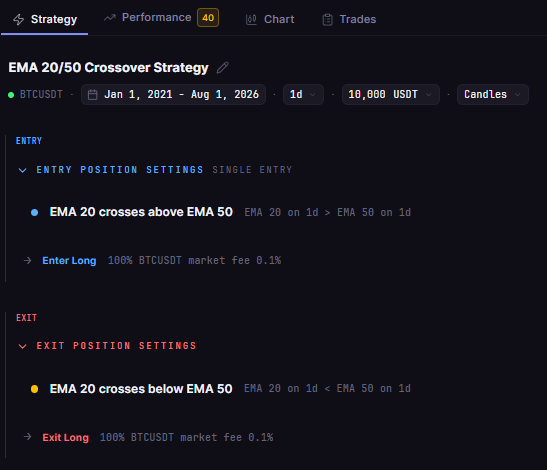
The same crossover rule in CoinQuant, typed in plain English and shown as editable entry and exit blocks, with no Pine Script. TradingView's Properties in CoinQuant: $10,000 initial capital, 100% of equity, a 0.1% taker fee and a January 1, 2021 to August 1, 2026 window.
Screenshot from the author's CoinQuant account. Backtest results are hypothetical, based on historical data with modelled fees, and do not guarantee future performance. Not financial advice.
For a side-by-side of the two platforms, see CoinQuant vs TradingView for crypto backtesting. For more rules written without code, see Tired of Pine Script? Backtest Any Crypto Strategy Without Code.
The Practical Lesson
A TradingView backtest is a strategy plus its Properties. Record capital, order size, commission, slippage and fill settings with every result.
Change one thing at a time. Parameters move results, so one change per run is the only way to know what helped.
Check the blind spots first. Costs, repainting, trade count, a benchmark and realistic sizing decide whether the number means anything.
Code is optional. The same crossover can be typed as one sentence and tested with the same settings.
Start with one rule you already trust, write it down in plain English and test it before you change anything. Try the same crossover idea without Pine Script. Start your first backtest on CoinQuant
Disclaimer:
Key Takeaway
