
Pullback Trading Strategy on Cardano: Buying 20 EMA Reclaims Above the 100-Day SMA (2021-2026)

Buying the dip only while the trend is up is a simple pullback trading strategy crypto traders can write down. We tested a strict version on Cardano: buy when ADA closes back above its 20-day EMA while above the 100-day SMA, and sell on a close below the 50-day EMA. From August 2021 to August 2026 it lost 26.16% over 26 trades, while ADA buy and hold lost 86.76%.
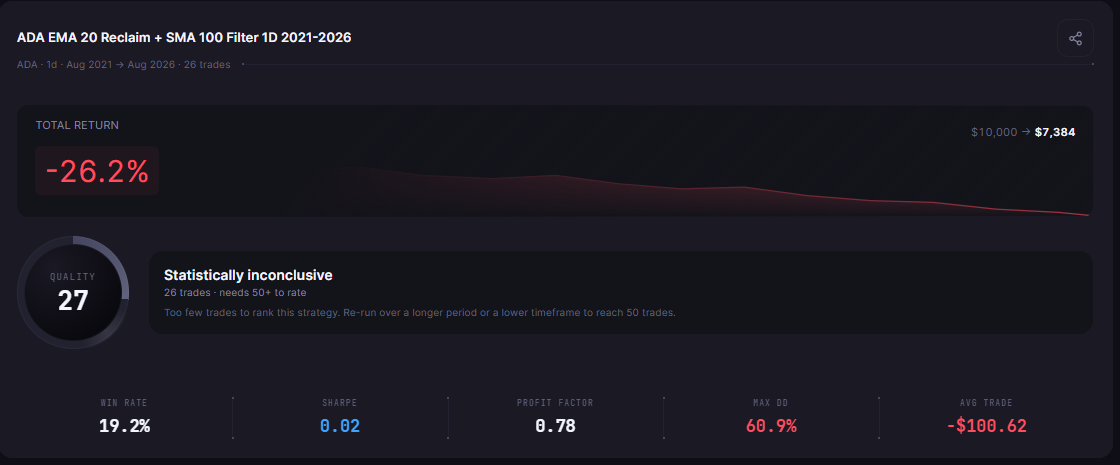
Losing less is not the same as winning. Only five of the 26 trades made money (a 19.23% Win Rate), one trade carried the whole result, and the strategy still sat through a 60.89% Max Drawdown. On the Performance tab, the results card marks this run "Statistically inconclusive": 26 trades, and it needs 50+ to rate.
This article tests the rule as stored in CoinQuant on five years of daily ADAUSDT data, with a 0.1% fee on entry and exit, and reports the results without adjustment. No tuned parameters, no cherry picked dates.
The Rule: Reclaim the 20 EMA While Above the 100-Day SMA
A pullback strategy needs two parts: a trend filter that says the market is rising, and a trigger that says the dip is over. This one uses the 100-day simple moving average (SMA) as the filter and a close back above the 20-day exponential moving average (EMA) as the trigger.
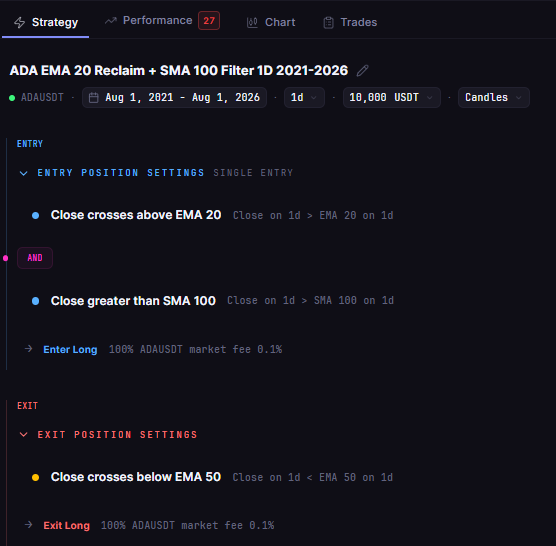
- Entry: Close crosses above EMA(period 20) and Close is greater than SMA(period 100), in one AND group, so both must be true on the same bar.
- Exit: Close crosses below EMA(period 50).
- Direction: long only, one position at a time.
In CoinQuant, you write a rule like this in plain English, with no coding required, for example: "Buy ADAUSDT on the daily chart when the close crosses above the 20-day EMA and the close is above the 100-day SMA. Sell when the close crosses below the 50-day EMA."
The platform turns that sentence into entry and exit rules and backtests them on historical data. Its changelog for 13 July 2026 says CoinQuant "now understands and builds retest and reclaim trading strategies" across indicators such as EMA and SMA.
Test Setup
The strategy is saved in the author's CoinQuant library as ADA EMA 20 Reclaim + SMA 100 Filter 1D 2021-2026. The settings below are exactly as stored.
| Parameter | Setting |
|---|---|
| Strategy | ADA EMA 20 Reclaim + SMA 100 Filter 1D 2021-2026 |
| Instrument | ADAUSDT (spot, Binance) |
| Data source | Kaiko via CoinQuant |
| Timeframe | Daily (1D) |
| Tested window | 2021-08-01 to 2026-08-01 |
| First trade to last exit | 2021-09-11 to 2025-10-07 (no position open at the end of the test) |
| Entry | Close crosses above EMA(period 20) AND Close greater than SMA(period 100), one AND group, market order |
| Exit | Close crosses below EMA(period 50), market order |
| Direction | Long only, one position at a time, no leverage |
| Initial capital | $10,000 |
| Position size | 100% of equity per entry |
| Fees | 0.1% taker on entry and 0.1% on exit, modelled on every fill (no slippage set) |
| Baselines (same window) | ADA Buy and Hold 1D 2021-2026; BTC Buy and Hold 1D 2021-2026 |
On the Strategy tab, both entry conditions are listed above the exit rule. There is no stop loss, no take profit and no other filter.
Pullback Trading Strategy: Crypto Results vs ADA Buy and Hold
Over the full window, the strategy turned $10,000 into $7,383.96, a Total Return of -26.16%. Holding ADA turned the same $10,000 into $1,324.39 (-86.76%), and holding Bitcoin finished at $15,733.43 (+57.33%).
| Metric | Pullback strategy | ADA buy and hold | BTC Spot Comparison |
|---|---|---|---|
| Strategy | ADA EMA 20 Reclaim + SMA 100 Filter 1D 2021-2026 | ADA Buy and Hold 1D 2021-2026 | BTC Buy and Hold 1D 2021-2026 |
| Total Return | -26.16% | -86.76% | +57.33% |
| Final Balance | $7,383.96 | $1,324.39 | $15,733.43 |
| Total Trades | 26 | 1 | 1 |
| Win Rate | 19.23% (5W / 21L) | n/a (single hold) | n/a (single hold) |
| Profit Factor | 0.78 | n/a (single hold) | n/a (single hold) |
| Sharpe Ratio | 0.02 | -0.02 | 0.44 |
| Max Drawdown | 60.89% | 95.15% | 76.63% |
| Total Fees | $399.20 | $11.32 | $25.74 |
All three runs share the same window, capital, sizing and 0.1% fee on entry and exit, so the rows compare like with like.
The strategy beat holding ADA on Total Return and on Max Drawdown (60.89% against 95.15%), mostly by staying out of the market: it held a position only 13.93% of the time. Its Sharpe Ratio of 0.02 is close to zero, and it trailed Bitcoin by a wide margin.
The platform's Buy and Hold benchmark carries no fees and ends at -86.73%, so the table uses the ADA Buy and Hold 1D 2021-2026 strategy (-86.76%), which pays the 0.1% fee on entry and exit.
Data note: CoinQuant's ADAUSDT daily data has no bars from 2021-09-12 to 2021-09-14, and the platform does not flag the gap. The first trade (entered 2021-09-11, exited 2021-09-20) spans it and returned -22.74% after fees (-$2,271.62).
The results card on the Performance tab sums up the same run: the trade count, the Total Return, the balance line and the Quality score.
What the Trades Show
Every one of the 26 trades closed on the exit signal, and none was open when the test ended.
One trade carried the result
The best trade entered on 2024-11-06 and exited on 2024-12-19, returning +142.25% after fees, or $7,939.72. The other 25 trades lost more than that in total, which is why the strategy still finished at -26.16%.
The average winning trade returned +31.82% after fees and the average losing trade -5.97%, the usual trend following profile. With only five winners, one big move did most of the work.
Losses came often and in runs
- Worst trade: entered 2025-03-02, exited 2025-03-07, -28.09% after fees (-$3,406.20).
- Longest losing streak: six trades in a row.
- Quick reversals: seven trades were closed one bar after entry, and all seven lost.
A Profit Factor of 0.78 means gross profits covered only about three quarters of gross losses. And 26 trades sits under the line in CoinQuant's guide on how to know if your trading strategy is overfit, which says of Win Rate, Profit Factor and Sharpe Ratio: "Below 30 trades, all of these numbers are dominated by randomness." Read every figure here as indicative.
How the Trend Filter Changed Trade Timing
The filter's biggest effect was on when the strategy did nothing. After the third trade closed on 2021-10-10, the next entry did not come until 2023-02-14: 492 days in which the SMA 100 filter and the EMA 20 reclaim never lined up on the same bar.
Sitting in cash for that stretch is a large part of why the strategy lost far less than holding ADA. A version without the filter was not run, so this test cannot say how it would have done.
The trades that did happen came in clusters:
- Late 2021: three trades, all losers, starting with the trade that spans the data gap.
- 2023 and early 2024: 12 trades, with only two clear gains (3.68% and 10.35% after fees).
- Late 2024 to October 2025: 11 trades, including the +142.25% winner, then no entry after 2025-10-07.
For how trend filters compare on Bitcoin, see EMA 20/50 vs SMA 200 on Bitcoin.
What This Test Cannot Tell You
Twenty-six trades are too few to separate skill from luck. One trade made the difference between a small loss and a much larger one, and a slightly different window could have missed it.
- One coin, one window, one parameter set: daily ADAUSDT from 2021-08-01 to 2026-08-01. Other coins or settings could behave very differently.
- Costs: the 0.1% fee on entry and exit is included, but no slippage was set, so real fills could be slightly worse.
- Data gap: the missing ADAUSDT bars from 2021-09-12 to 2021-09-14 sit inside the first trade.
- No forecast: the test says nothing about the market after August 2026.
For buying the dip without a trend filter, see does buying the dip work in crypto, which tests it on Bitcoin. For where pullbacks sit among other approaches, see crypto trading strategies: every type explained.
The Practical Lesson
- The filter cut the damage: -26.16% against -86.76% for holding ADA, with a Max Drawdown of 60.89% against 95.15%.
- It still lost money: and it finished far behind holding Bitcoin (+57.33%).
- One trade did the heavy lifting: a single +142.25% trade, while 21 of the 26 trades lost.
- The sample is small: the results card marks 26 trades "Statistically inconclusive".
Treat this rule as a way to stay out of long declines, not a finished strategy. In CoinQuant, an AI trading platform, you can keep the reclaim trigger and test a different filter, exit or coin, each as its own backtest. Multi-indicator and multi-timeframe conditions are supported, so a higher timeframe filter is one more variant to test.
Build trading strategies on real data. No coding required.
Frequently Asked Questions
Does buying pullbacks in an uptrend work in crypto?
In this test it lost less than holding but did not make money: -26.16% over 26 trades on daily ADA from 2021-08-01 to 2026-08-01, against -86.76% for ADA buy and hold. The results card marks it "Statistically inconclusive".
What is an EMA reclaim strategy?
An EMA reclaim strategy buys when the price closes back above an exponential moving average after trading below it. Here a reclaim of the 20-day EMA only counted while the close was above the 100-day SMA.
Which moving average works best as a trend filter for pullback trading?
This article tested one filter, the 100-day SMA, so it cannot rank filters. Test alternatives such as a 50-day or 200-day average on the same coin, window and fee, then compare.
Put your strategy to the test. Build and backtest it with CoinQuant. Backtest your strategy
Disclaimer:
Key Takeaway