
One Bitcoin Rule on the Daily and the 4-Hour Chart

The same Bitcoin rule, run on CoinQuant from 1 Jan 2023 to 1 Aug 2026 with fees included, made 127.82% on daily candles over 106 trades and -45.18% on 4-hour candles over 669 trades. Both versions trailed simply holding Bitcoin on the same window, which made 277.31%.
That is the daily chart vs 4 hour chart question with everything else held still: one rule, one coin, one window, one fee. The faster chart did not find a better trend. It traded six times as often, paid more than three times the fees and turned a gain into a loss. Neither version beat holding.
This article shows the rule as stored on CoinQuant, an AI trading platform, puts the two timeframes next to each other and next to Buy and Hold, and reports the results without adjustment. No tuned parameters, no cherry picked dates.
The Answer First: What Changed on the Faster Chart
Only the candle size changed. Everything that follows comes from that one switch.
- Trades: 106 on the daily chart, 669 on the 4-hour chart.
- Fees: $4,733.81 against $14,936.95.
- Total Return: 127.82% against -45.18%.
- Max Drawdown: 36.69% against 64.59%.
- Holding Bitcoin on the same window: 277.31%, ahead of both.
The time in the market barely moved: the daily rule held Bitcoin 50.80% of the time and the 4-hour rule 49.39%. So the 4-hour rule was not more exposed to Bitcoin. It was in and out more often, and every round trip paid the fee twice.
The Rule, the Settings and the Window
The rule is a plain trend follower built from a short prompt on CoinQuant, with no coding required. It uses a DEMA, a double exponential moving average that reacts faster than a simple average. As stored, it has one entry and one exit:
- Entry: the close crosses above the DEMA (20).
- Exit: the close crosses below the DEMA (20).
On the daily chart that close is the daily candle. On the 4-hour chart it is each 4-hour candle, so the rule gets six chances a day to act.
| Parameter | Setting |
|---|---|
| Strategy | BTC DEMA 20 Close Cross 1D 2023-2026 and BTC DEMA 20 Close Cross 4H 2023-2026 |
| Instrument | BTCUSDT (spot, Binance) |
| Data source | Kaiko via CoinQuant |
| Timeframes | Daily (1D) and 4-hour (4H) |
| Tested window | 2023-01-01 to 2026-08-01 (4H data ends 2026-08-01 20:00 UTC, as the backtest reports) |
| Entry | Close crosses above DEMA (20), market order |
| Exit | Close crosses below DEMA (20), market order |
| Direction | Long only, one position at a time, no leverage |
| Initial capital | $10,000 |
| Position size | 100% of equity per entry |
| Fees | 0.1% taker, on every entry and exit (no slippage modelled) |
| Baseline (same window) | BTC Buy and Hold 1D 2023-2026 |
Both rules were built and backtested on the team's CoinQuant account on 6 November 2026. The window starts on 1 January 2023 and ends on 1 August 2026, so it covers the 2023 to 2024 rise and the fall that followed the October 2025 high.
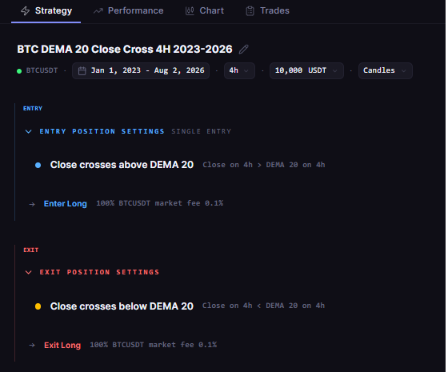
The stored rule of BTC DEMA 20 Close Cross 4H 2023-2026 on BTCUSDT 4-hour candles: enter long when the close crosses above the 20 period DEMA, listed above the exit when the close crosses back below it.
Trades and Fees: Daily Chart vs 4 Hour Chart
The 4-hour rule made 669 trades, about six times the daily rule's 106. Each trade pays 0.1% to buy and 0.1% to sell, so the fee bill grew with the count.
| Metric | Daily (1D) | 4-hour (4H) |
|---|---|---|
| Strategy | BTC DEMA 20 Close Cross 1D 2023-2026 | BTC DEMA 20 Close Cross 4H 2023-2026 |
| Total Trades | 106 | 669 |
| Total Fees | $4,733.81 | $14,936.95 |
| Time in Market | 50.80% | 49.39% |
| Win Rate | 33.96% | 25.86% |
| Average Trade | $120.59 | -$6.75 |
The 4-hour rule paid $14,936.95 in fees, more than three times its own loss over the window. A small average loss per trade, -$6.75, adds up over 669 trades.
The Win Rate fell too, from 33.96% to 25.86%. On faster candles the close crosses the DEMA (20) back and forth more often, so more trades end as small losses before a trend can develop. The trade log shows it: the longest run of losing trades was eight on the daily chart and 18 on the 4-hour chart.
Drawdown and Return
The daily rule turned $10,000 into $22,782.47, a Total Return of 127.82%. The 4-hour rule ended at $5,481.75, a Total Return of -45.18%.
| Metric | Daily (1D) | 4-hour (4H) |
|---|---|---|
| Strategy | BTC DEMA 20 Close Cross 1D 2023-2026 | BTC DEMA 20 Close Cross 4H 2023-2026 |
| Total Return | 127.82% | -45.18% |
| Final Balance | $22,782.47 | $5,481.75 |
| Max Drawdown | 36.69% | 64.59% |
| Profit Factor | 1.30 | 0.93 |
| Sharpe Ratio | 0.87 | -0.31 |
| CAGR | 25.83% | -15.43% |
A Profit Factor of 1.30 means the daily rule's winners made $1.30 for every dollar its losers gave back. At 0.93, the 4-hour rule's losers outweighed its winners. Its Max Drawdown of 64.59% was also the deeper fall, and the 4-hour run was still at that low on its last bar.
The results card on the Performance tab shows the daily run's Total Return and balance.
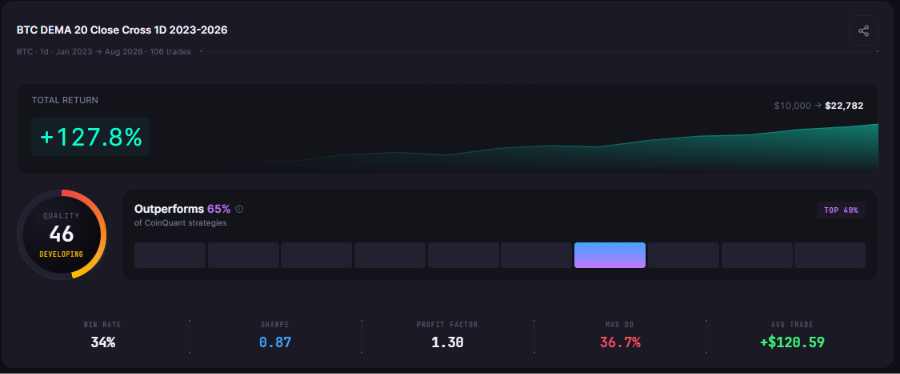
BTC DEMA 20 Close Cross 1D 2023-2026, tested from January 2023 to August 2026: 106 trades, +127.8%, $10,000 to $22,782 and QUALITY 46 next to "Outperforms 65% of CoinQuant strategies".
Buy and Hold Comparison: Same Coin, Same Window
Holding Bitcoin for the whole window beat both timeframes. The comparison below uses the library strategy BTC Buy and Hold 1D 2023-2026, which buys on the first candle, sells on the last and pays the same 0.1% fee on entry and exit.
| Metric | Daily rule | 4-hour rule | BTC Spot Comparison (same window) |
|---|---|---|---|
| Strategy | BTC DEMA 20 Close Cross 1D 2023-2026 | BTC DEMA 20 Close Cross 4H 2023-2026 | BTC Buy and Hold 1D 2023-2026 |
| Total Return | 127.82% | -45.18% | 277.31% |
| Final Balance | $22,782.47 | $5,481.75 | $37,730.92 |
| Total Trades | 106 | 669 | 1 |
| Win Rate | 33.96% | 25.86% | n/a (single hold) |
| Profit Factor | 1.30 | 0.93 | n/a (single hold) |
| Sharpe Ratio | 0.87 | -0.31 | 1.03 |
| Max Drawdown | 36.69% | 64.59% | 52.97% |
| CAGR | 25.83% | -15.43% | 44.85% |
| Total Fees | $4,733.81 | $14,936.95 | $47.76 |
All three runs share the same window, capital, sizing and fee, so the rows compare like with like. The daily rule's one real advantage was a shallower Max Drawdown, 36.69% against 52.97% for holding.
The Performance tab cards rate the two rules: the daily run shows QUALITY 46 next to "Outperforms 65% of CoinQuant strategies" and the 4-hour run shows QUALITY 25 next to "Outperforms 24% of CoinQuant strategies". The Buy and Hold card shows QUALITY 62 next to "Statistically inconclusive", as any single hold does.
The equity cards draw each rule against the platform's Buy and Hold line. That line is the platform's own benchmark and carries no fees, while BTC Buy and Hold 1D 2023-2026 in the table pays the 0.1% fee on entry and exit, so their end values differ slightly.
Which Reader Each Timeframe Suits
This is one rule on one coin, so it cannot crown a timeframe. It does show what each chart asks of the trader.
| Daily chart | 4-hour chart |
|---|---|
| One decision a day, at the daily close | Six decisions a day, one at each 4-hour close |
| 106 trades and $4,733.81 in fees on this window | 669 trades and $14,936.95 in fees on this window |
| Suits a trader who checks once a day | Needs a rule whose edge per trade is larger than the fee |
If you can only look once a day, the daily chart fits your week, as daily rules you check once a day explains. A faster chart only makes sense if each trade earns more than it costs, and here it did not.
Keep the limits in view:
- Costs: fees included (0.1% taker fee on entry and exit); no slippage modelled.
- Structure: long only, one position at a time, no leverage.
- Scope: one rule, one coin, one window. Other averages or periods were not tested.
- The future: past results do not predict future results.
The same idea of changing one thing at a time ran through two earlier tests: two years or five on the same Bitcoin 4h rule, and the same Bitcoin rule on Binance and Coinbase data. If you want both timeframes in one rule, Multi-Timeframe RSI Strategy: 4H Entry + 1D Trend Filter on Bitcoin uses the daily trend as a filter for 4-hour entries.
The Practical Lesson
- Count the trades first: the 4-hour rule traded 669 times against 106 on the daily chart.
- Price the fees: $14,936.95 against $4,733.81, on the same $10,000 start.
- Keep the benchmark fixed: holding Bitcoin made 277.31% on this window, ahead of both timeframes.
Before you move a rule to a faster chart, compare trade count and fees on the same window: more trades means more fees, and the benchmark does not change. In CoinQuant you can rebuild the same rule on another timeframe in plain English and test it on the same dates. Multi-timeframe rules, such as a daily filter with 4-hour entries, can be written the same way.
Build trading strategies on real data. No coding required.
Frequently Asked Questions
Is the 4-hour chart better than the daily for Bitcoin?
Not for this rule. On the same window it made -45.18% on 4-hour candles and 127.82% on daily candles, and both trailed holding Bitcoin at 277.31%.
Why do more trades cost more?
Every trade pays the fee twice, once to buy and once to sell. The 4-hour rule made 669 trades and paid $14,936.95 in fees; the daily rule made 106 and paid $4,733.81.
What is the best timeframe for a trend rule?
There is no single answer. Test the same rule on each timeframe over the same window, then compare trade count, fees, Max Drawdown and Buy and Hold before you choose.
Test the same rule on your own window, or try another timeframe.
Disclaimer:
Key Takeaway