Multi-Timeframe RSI Strategy: 4H Entry + 1D Trend Filter on Bitcoin
.png)
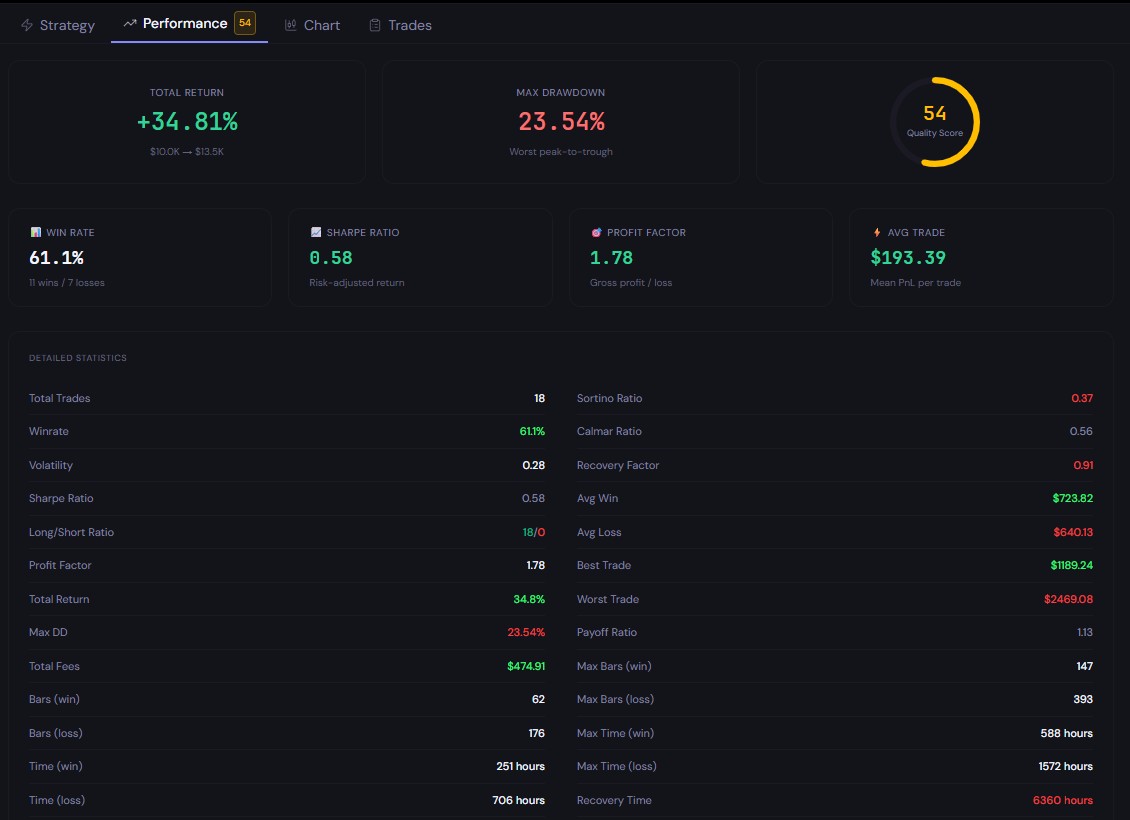
Adding a single trend filter to a standard RSI strategy increased total return from 27.18% to 34.81%, cut max drawdown from 42.42% to 23.54%, and raised the Sharpe ratio from 0.46 to 0.58. Same asset. Same timeframe. Same entry logic. One extra condition. This is what multi-timeframe analysis actually does to your numbers.
Most traders use RSI on a single timeframe and wonder why their mean-reversion signals keep failing. The answer is almost always the same: they are buying oversold conditions in a downtrend. A coin can be oversold on the 4H chart and still be in a sustained bear move on the daily. Adding a higher-timeframe trend filter solves this. It tells the strategy to only take mean-reversion entries when the broader market structure supports them.
We backtested this exact setup on BTC/USDT 4H using CoinQuant. Here is what the data shows.
The Strategy
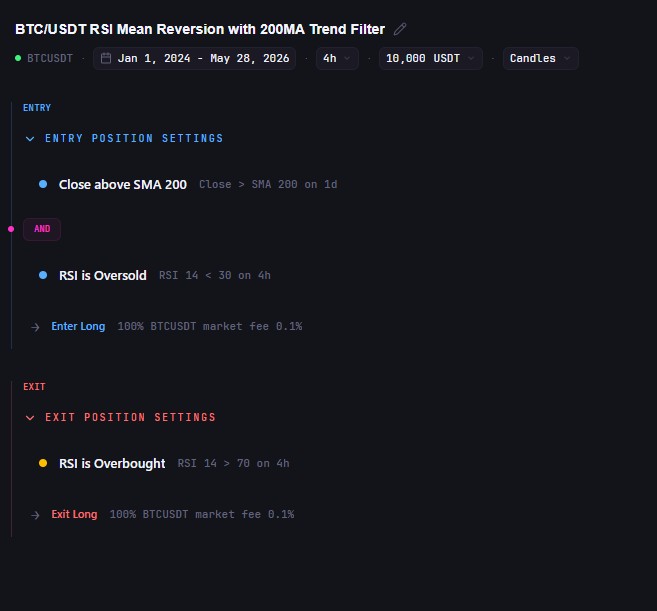
Two conditions must both be true before a trade fires:
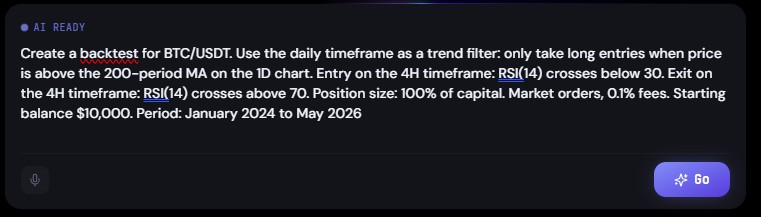
Trend filter (1D): Price is above the 200-period MA on the daily chart. The macro trend is up.
Entry signal (4H): RSI(14) crosses below 30 on the 4H chart. A short-term oversold condition within an uptrend.
Exit (4H): RSI(14) crosses above 70 on the 4H chart.
Execution: Market orders, 0.1% fees, 100% position size, starting balance $10,000.
Period: January 2024 to May 2026. Data from Binance via Kaiko.
The logic is straightforward. The 200MA on the daily is one of the most widely watched trend indicators in crypto. Price above it means the market is in a broadly bullish structure. RSI below 30 on the 4H means price has pulled back sharply within that structure. You are buying a dip inside an uptrend, not catching a falling knife in a downtrend.
The Backtest Results
Strategy: BTC/USDT RSI Mean Reversion with 200MA Trend Filter. Period: January 2024 to May 2026. Starting balance: $10,000. Data from Binance via Kaiko.
18 trades over 2.4 years. That is roughly one trade every six to seven weeks. The strategy is selective: it only enters when both conditions align. That selectivity is exactly the point.
What the Filter Actually Did
The plain RSI strategy from our previous backtest: same asset, same timeframe, same entry and exit logic, no trend filter. Results over the same period:
The filter removed five trades. Those five trades were net losers: RSI triggered an oversold buy signal while BTC was trading below the 200MA on the daily, meaning the macro trend was bearish. Removing them increased total return, nearly halved the drawdown, and improved profit factor by 33%.
Win rate dropped slightly from 65.22% to 61.1%. That is expected. With fewer trades, each loss carries more weight. But the quality of each trade improved. Profit factor went from 1.34 to 1.78, meaning for every dollar lost, the strategy now earns $1.78 rather than $1.34.
Higher return. Lower drawdown. Better risk-adjusted performance. Five fewer trades. The filter did its job.
Why the 200MA Works as a Trend Filter
The 200-period moving average on the daily chart is a long-term trend indicator. When price is above it, the asset is in a broad uptrend. When price is below it, the asset is in a broad downtrend.
RSI is a mean-reversion indicator. It works best when price has pulled back sharply within an existing trend. Combining RSI oversold signals with a 200MA trend filter does two things: it confirms that a pullback has occurred (RSI below 30) and confirms that the pullback is happening inside an uptrend (price above 200MA). That combination produces cleaner entries with more follow-through.
Without the filter, RSI below 30 just means price fell hard. It could be a dip in an uptrend or the beginning of a sustained downtrend. With the filter, you know it is the former.
The Tradeoff
The filter reduces trade frequency. 18 trades over 2.4 years means the strategy sits out for extended periods. During those periods, when BTC is trading below the 200MA, the strategy does nothing. Some traders find this psychologically difficult. The temptation to override the filter and take the RSI signal anyway is real.
The data is clear: the trades the filter blocked were losing trades on net. Overriding the filter to increase activity would have reduced returns and increased drawdown. Sitting out during downtrends is not a flaw. It is the strategy working as designed.
The Bottom Line
A single trend filter transformed a standard RSI strategy from a 27.18% return with 42.42% drawdown into a 34.81% return with 23.54% drawdown. The improvement came entirely from removing bad trades, not from finding better ones.
Run this backtest on CoinQuant and compare it against your own RSI strategy. Then add the 200MA filter and run it again. The difference in your numbers will tell you everything you need to know.
Run this backtest free on CoinQuant
Disclaimer:
This content is for educational and informational purposes only and does not constitute financial, investment, or trading advice. All strategies and examples are for illustrative purposes and do not guarantee results. Past performance does not guarantee future results. Backtest data verified via CoinQuant. Always conduct your own research before making financial decisions.
Key Takeaway