
MFI Oversold Strategy on Ethereum: Buying Money Flow Index Recoveries From 20 (2021-2026)
This MFI oversold strategy traded only seven times in five years, so read every number below as a small sample first. The rule buys Ethereum when the Money Flow Index (MFI) climbs back above 20 and sells when it crosses above 80. On daily ETHUSDT from August 2021 to August 2026 it returned 547.50% after fees, while ETH buy and hold lost 27.95%.
Seven trades cannot settle anything on their own. All seven closed in profit, the last one only because the test ended, so the Profit Factor cannot even be calculated. Before you lean on a result like this, read how to know if your trading strategy is overfit.
This article builds the classic MFI 20/80 rule in CoinQuant, tests it on five years of daily ETH data with a 0.1% fee on every fill, lists every trade and reports the results without adjustment. No tuned parameters and no selective dates.
The Rule: Buy MFI Recoveries From 20, Sell at 80
The Money Flow Index runs from 0 to 100 and folds volume into a momentum reading. CoinQuant's indicator documentation describes MFI as a momentum gauge weighted by volume, often called a volume powered RSI, and lists the classic zones: overbought above 80, oversold below 20. The oversold rule buys the recovery, the moment MFI crosses back above 20, and holds until MFI reaches 80.
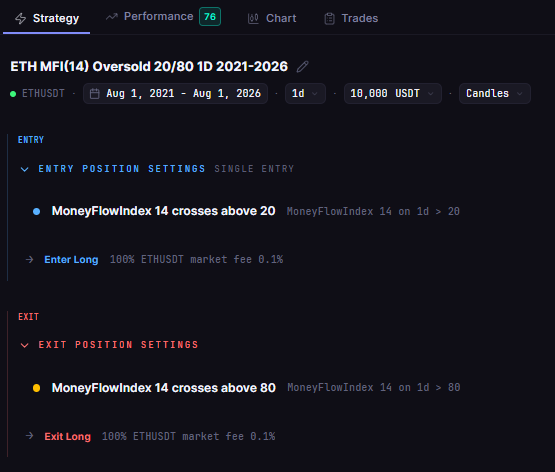
- Entry: MFI (period 14) crosses above 20 on the daily chart
- Exit: MFI (period 14) crosses above 80
- Nothing else: no stop loss, no take profit and no trend filter, so a trade stays open until the exit cross or the end of the test
In CoinQuant, an AI trading platform, you type a rule like this in plain English and the platform turns it into one entry condition and one exit condition, then backtests it on historical data. No coding required. A prompt in this form describes the same two conditions:
Buy ETHUSDT on the daily chart when the Money Flow Index (period 14) crosses above 20. Sell when it crosses above 80. Test from August 1, 2021 to August 1, 2026 with $10,000, 100% of equity per trade and a 0.1% fee.
Test Setup
The strategy is saved in the author's CoinQuant library as ETH MFI(14) Oversold 20/80 1D 2021-2026. The settings below are exactly as stored.
| Parameter | Setting |
|---|---|
| Strategy | ETH MFI(14) Oversold 20/80 1D 2021-2026 |
| Instrument | ETHUSDT (spot, Binance) |
| Data source | Kaiko via CoinQuant |
| Timeframe | Daily (1D) |
| Tested window | 2021-08-01 to 2026-08-01 |
| First trade to last exit | 2022-06-21 to 2026-08-01 (the last trade was closed at the end of the test) |
| MFI settings | Period 14 |
| Entry | MoneyFlowIndex(period=14) crosses above 20, market order |
| Exit | MoneyFlowIndex(period=14) crosses above 80, market order |
| Direction | Long only, one position at a time, no leverage |
| Initial capital | $10,000 |
| Position size | 100% of equity per entry |
| Fees | 0.1% taker on entry and 0.1% on exit, modelled on every fill (no slippage set) |
| Baselines (same window) | ETH Buy and Hold 1D 2021-2026; BTC Buy and Hold 1D 2021-2026 |
On the Strategy tab, the whole strategy reads as two plain conditions on daily ETHUSDT, with the entry cross above 20 listed above the exit cross above 80.
MFI Oversold Strategy Results vs ETH Buy and Hold
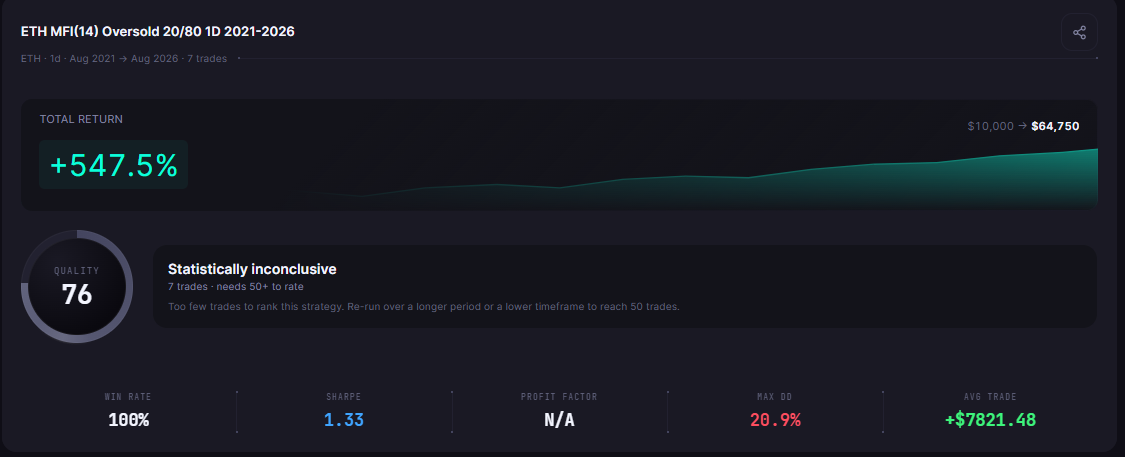
Start with the sample: seven trades in five years. With that caveat in place, the rule turned $10,000 into $64,750.33, a Total Return of 547.50%. Holding ETH turned the same $10,000 into $7,205.03 (-27.95%), and holding Bitcoin finished at $15,733.43 (+57.33%).
| Metric | MFI 20/80 | ETH buy and hold | BTC Spot Comparison |
|---|---|---|---|
| Strategy | ETH MFI(14) Oversold 20/80 1D 2021-2026 | ETH Buy and Hold 1D 2021-2026 | BTC Buy and Hold 1D 2021-2026 |
| Total Return | +547.50% | -27.95% | +57.33% |
| Final Balance | $64,750.33 | $7,205.03 | $15,733.43 |
| Total Trades | 7 | 1 | 1 |
| Win Rate | 100.00% (7W / 0L) | n/a (single hold) | n/a (single hold) |
| Profit Factor | n/a (no losing trades) | n/a | n/a |
| Sharpe Ratio | 1.33 | 0.26 | 0.44 |
| Max Drawdown | 20.90% | 79.30% | 76.63% |
| CAGR | +45.26% | -6.34% | +9.48% |
| Time in Market | 20.91% | 100.00% | 100.00% |
| Total Fees | $468.47 | $17.20 | $25.74 |
All three runs share the same window, capital, sizing and 0.1% fee, so the rows compare like with like. Win Rate and Profit Factor are not shown for buy and hold because each baseline is a single trade.
Profit Factor shows n/a because there was no losing trade: it divides gross profit by gross loss, and the gross loss here is zero. The Max Drawdown of 20.90% was far shallower than the 79.30% that ETH buy and hold sat through.
On the Performance tab, the results card marks this run "Statistically inconclusive": seven trades, and it needs 50+ to rate. The platform's Buy and Hold benchmark carries no fees and ends at -27.81%, so the table uses the ETH Buy and Hold 1D 2021-2026 strategy (-27.95%), which pays the 0.1% fee on entry and exit.
What the Trades Show
Every trade is listed below with its return after the 0.1% entry and exit fees, using the fill dates the backtest reports.
| Trade | Entry | Exit | Return after fees | Net P&L after fees | Closed by |
|---|---|---|---|---|---|
| 1 | 2022-06-21 | 2022-07-19 | +36.75% | +$3,671.79 | Exit rule |
| 2 | 2023-08-19 | 2023-12-05 | +37.11% | +$5,069.13 | Exit rule |
| 3 | 2024-01-26 | 2024-02-12 | +17.08% | +$3,198.27 | Exit rule |
| 4 | 2024-08-06 | 2024-11-11 | +36.75% | +$8,053.60 | Exit rule |
| 5 | 2025-04-09 | 2025-07-11 | +76.91% | +$23,045.52 | Exit rule |
| 6 | 2026-02-06 | 2026-03-17 | +12.10% | +$6,410.20 | Exit rule |
| 7 | 2026-06-08 | 2026-08-01 | +8.93% | +$5,301.83 | End of test |
Long gaps between signals
The first signal did not arrive until 2022-06-21, and no trade opened between 2022-07-19 and 2023-08-19. The average trade returned 32.23% after fees and lasted about 62 days.
One trade carried the biggest share
The best trade, bought on 2025-04-09 and sold on 2025-07-11, returned 76.91% after fees, or $23,045.52. That single trade is 42.09% of the strategy's total dollar profit, helped by compounding: each entry used 100% of equity.
The last trade was closed by the end of the test
The seventh trade entered on 2026-06-08 and was still open when the test ended on 2026-08-01. The backtest closed it at the final bar for +8.93% after fees, so that exit came from the end of the window, not from MFI reaching 80.
How Often MFI Reaches 20 on ETH
Oversold readings are rare on daily ETH. The entry fired seven times in five years, about 1.4 trades a year, and the strategy was in the market for only 20.91% of the window.
That rarity cuts both ways. It kept the strategy out of the market most of the time, but each trade carries a large share of the result. In a sample of seven, one bad signal would move every metric in the table.
Signals that arrive while a trade is already open add nothing, because the strategy holds one position at a time. So seven is the number of trades, not necessarily the number of times MFI crossed back above 20.
Earlier MFI tests on Bitcoin used the midpoint instead of the extremes: see Money Flow Index Strategy on Bitcoin: Does MFI Predict Trend Continuation? and what 1D vs 4H backtest data reveals about MFI timing.
What This Test Cannot Tell You
- Sample size: seven trades, all winners. A single loss would change the Win Rate and make the Profit Factor computable.
- One coin, one window: daily ETHUSDT from 2021-08-01 to 2026-08-01. Other coins or start dates may give a different answer.
- One parameter set: MFI period 14 with 20 and 80 thresholds. No other settings were tested here.
- Costs: the 0.1% fee on entry and exit is included, but no slippage was set, so real fills could be worse.
- No forecast: the test says nothing about ETH after August 2026.
Buying oversold recoveries is a mean reversion idea. Mean reversion crypto strategy backtested: when it beats trend following shows where that style tends to work and where it does not.
The Practical Lesson
- It beat holding ETH by a wide margin: 547.50% against -27.95%, with a Max Drawdown of 20.90% against 79.30%.
- The sample is tiny: seven trades, and the results card marks the run "Statistically inconclusive".
- A perfect Win Rate is a warning sign: 100.00% with no losing trade means the Profit Factor cannot be measured at all.
Treat the MFI 20/80 rule on ETH as a hypothesis, not a finished crypto trading strategy. For any MFI oversold crypto setup, CoinQuant lets you rerun the rule on another coin, a longer window or a lower timeframe to collect more trades, or add a trend filter (it supports multi-indicator and multi-timeframe conditions). Each change needs its own backtest.
Build trading strategies on real data. No coding required.
Frequently Asked Questions
Does the MFI oversold strategy work on Ethereum?
In this test it made money: 547.50% after fees on daily ETHUSDT from 2021-08-01 to 2026-08-01, against -27.95% for ETH buy and hold. But it traded only seven times, so the result is a small sample, not proof of an edge.
Is Money Flow Index better than RSI for oversold signals?
This test does not compare them. MFI weights each price move by volume while RSI uses price alone, so the two can disagree on the same chart. The fair way to choose is to backtest both rules on the same coin, window and fee.
What MFI levels should I use for buy and sell signals?
The classic levels are 20 for oversold and 80 for overbought, which this test used. On daily ETH they produced only seven trades in five years, so a lower timeframe would give more signals to judge.
Put your strategy to the test. Build and backtest it with CoinQuant. Backtest your strategy
Disclaimer:
Key Takeaway