
Mean Reversion Crypto Strategy Backtested: When It Beats Trend-Following
Trend-following strategies get most of the attention in crypto. Buy breakouts, ride momentum, hold through volatility. That logic works well during sustained bull markets.
But crypto spends a significant portion of every cycle moving sideways, not trending. During those periods, a trend-following system generates false signals, takes losses on both sides, and erodes the gains it made during the trend. Mean reversion strategies are built for exactly this environment.
This article runs a mean-reversion approach on Bitcoin daily data from 2018 to mid-2026 and reports what the numbers actually show. The question is not whether mean reversion works in theory. It is whether it has worked on real crypto data, across full market cycles, with verified backtest results.
What Mean Reversion Actually Means
Mean reversion is the idea that prices tend to return to a historical average after moving too far in one direction. When a market overshoots to the downside, a mean-reversion strategy buys the dip expecting a snap-back. When it overshoots to the upside, the strategy exits or avoids new longs.
This is the opposite logic of trend-following. A trend-follower sees a large down move as momentum to short, or simply steps aside. A mean-reverter sees the same move as a buying opportunity.
The approach has a natural home in ranging markets: when price bounces repeatedly between support and resistance without breaking out, mean-reversion rules generate consistent small wins. The risk is that a real trend break turns a "buying the dip" entry into a big loss.
Strategy: Stochastic Oscillator Range-Bound
The strategy tested here uses the Stochastic Oscillator, one of the most widely used mean-reversion indicators in crypto. The Stochastic measures where the current closing price sits relative to the high-low range over a defined lookback period.
When the Stochastic is very low, price is near the bottom of its recent range, which is the mean-reversion buying opportunity. When it rises back to the top of its range, the strategy exits.
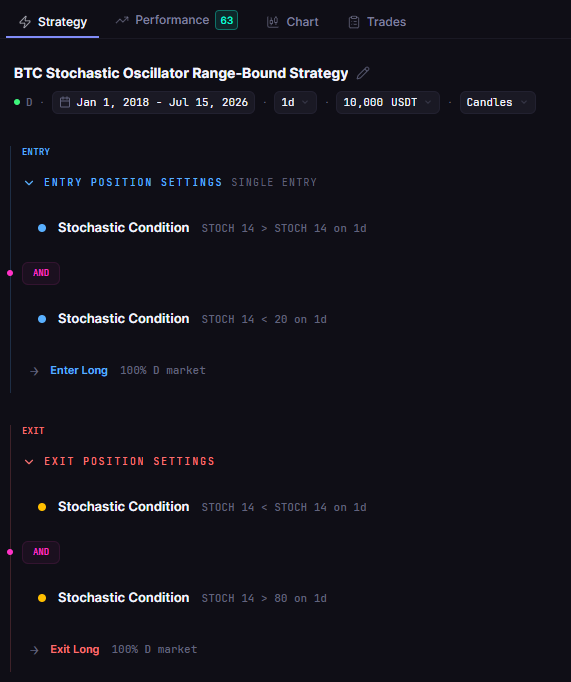
Entry: Stochastic (14,3,3) signal line rises from below 20 (oversold bounce)
Exit: Stochastic signal line reaches 80 (overbought exit signal)
Direction: Long only, no leverage
Test Setup
| Parameter | Setting |
|---|---|
| Instrument | BTCUSDT (spot) |
| Timeframe | Daily (1D) |
| Period | Jan 2018 to Jul 2026 |
| Indicator | Stochastic Oscillator (14,3,3) |
| Entry | Stochastic crosses above 20 |
| Exit | Stochastic reaches 80 |
| Direction | Long only, no leverage |
| Initial capital | $10,000 |
| Position size | 100% of equity |
| Fees | Binance standard (0.1% taker) |
| Slippage | 0% |
| Data source | Kaiko via CoinQuant |
The Backtest Results
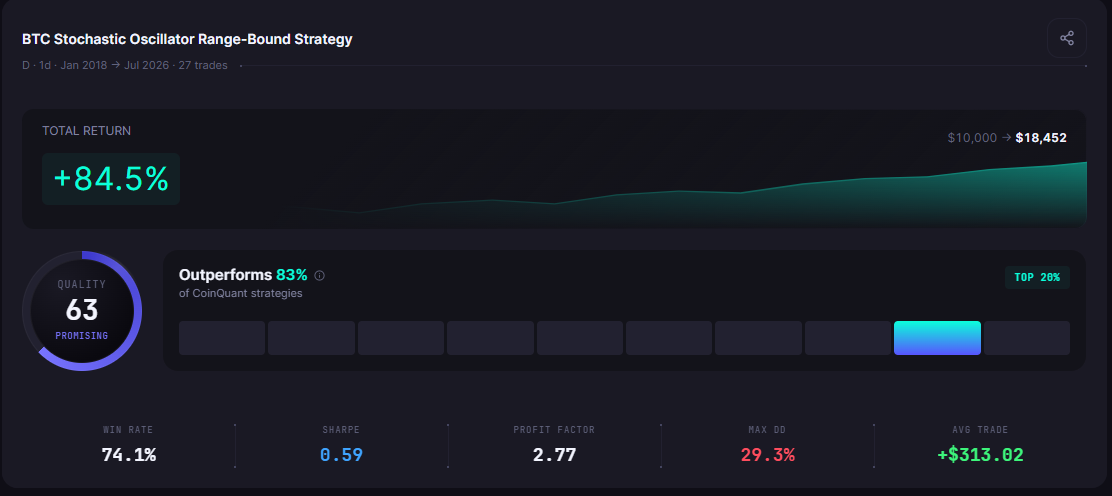
Over eight and a half years of Bitcoin data, the Stochastic mean-reversion strategy delivered a +84.5% total return from a $10,000 start, reaching $18,452. That came across 27 trades, with the strategy winning 74.1% of them. The max drawdown was 29.3%.
| Metric | Result |
|---|---|
| Total Return | +84.5% ($10,000 → $18,452) |
| Total Trades | 27 |
| Win Rate | 74.1% (20W / 7L) |
| Max Drawdown | 29.3% |
| Sharpe Ratio | 0.59 |
| Profit Factor | 2.77 |
| Period | Jan 2018 to Jul 2026 |
The 74.1% win rate is the standout number. Mean reversion strategies typically produce high win rates because they are capturing small, predictable bounces, not trying to hold through large, uncertain trends.
The max drawdown of 29.3% is relatively controlled for Bitcoin over an eight-year period that included two major bear markets. It reflects the strategy exiting at overbought levels and re-entering only on confirmed oversold bounces, rather than holding through extended drawdowns.
When Mean Reversion Beats Trend-Following
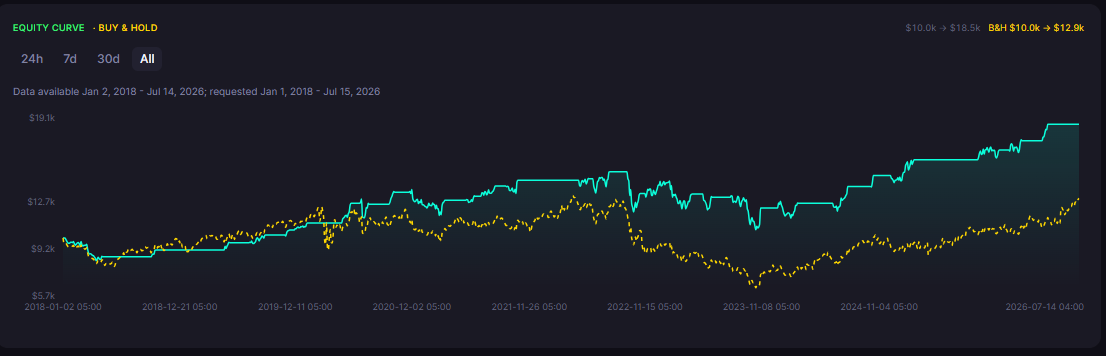
Looking at the data across the full eight-year period, the pattern is clear: the mean-reversion strategy performed best when Bitcoin was in consolidation or mild downtrend phases.
During Bitcoin's ranging periods (much of 2018-2019, most of 2022, and the 2025-2026 consolidation), the Stochastic generated clean oversold-to-overbought rotations with reliable win rates.
During strong trends (the 2020-2021 bull market, the late 2023 recovery), a few oversold signals turned into losing trades as Bitcoin continued lower before eventually recovering. These are the losses in the 7-loss column.
The critical insight: mean reversion works until it does not, and when it fails, it fails because a genuine trend started. The losing trades in this dataset largely correspond to periods where an oversold signal preceded a further decline rather than a bounce.
The Comparison: Mean Reversion vs Trend-Following on Bitcoin
Both approaches delivered strong results over their respective test windows. The Stochastic mean-reversion strategy returned +84.5% across eight and a half years (2018-2026) with a max drawdown of 29.3%. The Golden Cross trend-following strategy returned +87.34% over four and a half years (2022-2026) with a max drawdown of 37.10%. The returns are similar; the mean-reversion approach achieved them with meaningfully lower drawdown.
| Approach | Total Return | Win Rate | Max Drawdown | Key Risk |
|---|---|---|---|---|
| Mean reversion (Stochastic, 2018-2026) | +84.5% | 74.1% | 29.3% | Fails in strong trends |
| Trend-following (Golden Cross, 2022-2026) | +87.34% | 75.0% | 37.10% | Fails in choppy markets |
| BTC Spot (Buy & Hold) 2022-2026 | +22.80% | 100%* | 66.95% | Passive baseline |
The Golden Cross strategy returned +87.34% with a 37.10% max drawdown over a four-year window (2022-2026). The Stochastic mean-reversion strategy returned +84.5% with a 29.3% max drawdown over eight and a half years (2018-2026). The returns are similar; the drawdown is notably lower for the mean-reversion approach. Both operated across periods that included Bitcoin bull markets and ranging phases. The mean reversion case here is straightforward: comparable returns, meaningfully lower risk, and 27 confirmed entries across the full test period with a 74.1% win rate.
Why Regime Matters More Than Strategy Choice
The deeper lesson from this backtest is not which strategy is better in absolute terms. It is that market regime determines which approach wins.
In a ranging market, mean reversion wins. In a trending market, trend-following wins. The difficulty is that you do not always know which regime you are in while it is happening.
One practical approach: use a regime filter. A simple 200-day SMA filter could help. When Bitcoin is above its 200-day SMA (trending), lean toward trend-following systems. When it is below or oscillating around it (ranging), lean toward mean-reversion systems.
Both approaches benefit from being tested on data before being traded live. The results here show that both can work, but their conditions for success are different.
The Practical Takeaway
This backtest does not declare mean reversion superior to trend-following. It shows that a well-tested mean-reversion approach on Bitcoin produced a +84.5% return with 74.1% win rate across eight and a half years of data.
Those numbers are the honest output of a disciplined test. Whether a trader uses mean reversion depends on their market view, their risk tolerance, and whether they are trading through a ranging or trending regime.
The next step is to run the test yourself with different settings, different instruments, or different timeframes to see how the results change.
Disclaimer:
Key Takeaway
