
Money Flow Index Strategy on Bitcoin: Does MFI Predict Trend Continuation?

The Money Flow Index is a volume-weighted oscillator, and that volume weighting is what sets it apart from RSI. A bullish move backed by heavy volume is treated as more credible than the same move on thin participation. The standard question traders ask is whether that credibility survives as a rule: does MFI tell you when a move will continue?
This article answers it with two strategies from the CoinQuant strategy library: BTC MoneyFlowIndex(14) Midpoint Cross 1D and BTC MFI(14) Trend 4H (enter 60 exit 40). Both were backtested on Bitcoin over the 12 months to August 1, 2026, with fees included. The results are reported exactly as returned by the platform.
How the Two MFI Strategies Differ
Both strategies use the 14-period MFI, the default and most widely referenced setting. They differ in the signal they require and the timeframe they trade:
Midpoint Cross 1D: enter long when MFI(14) crosses above 50, exit when it crosses back below 50. Daily timeframe. The midpoint represents equilibrium between buying and selling pressure.
Trend 4H (enter 60 exit 40): enter long when MFI(14) crosses above 60, exit when it crosses below 40. Four-hour timeframe. The wider band filters out crossings near the midpoint, where signals are weakest.
The trend variant is the more demanding strategy. Requiring MFI to push above 60 before entering asks for stronger volume-backed momentum, which is the condition under which continuation should be most likely. Both are long-only, use 100% of equity, hold one position, and include fees in every result.
Test Setup
| Parameter | Value |
|---|---|
| Asset | BTCUSDT (Binance Spot) |
| Indicator | Money Flow Index (MFI), 14-period |
| Strategies Tested | Midpoint Cross 1D; Trend 4H (enter 60 exit 40) |
| Test Window | Aug 1, 2025 to Aug 1, 2026 |
| Fees and Slippage | Included |
| Data Source | Kaiko via CoinQuant |
Result 1: Midpoint Cross on Daily Bitcoin
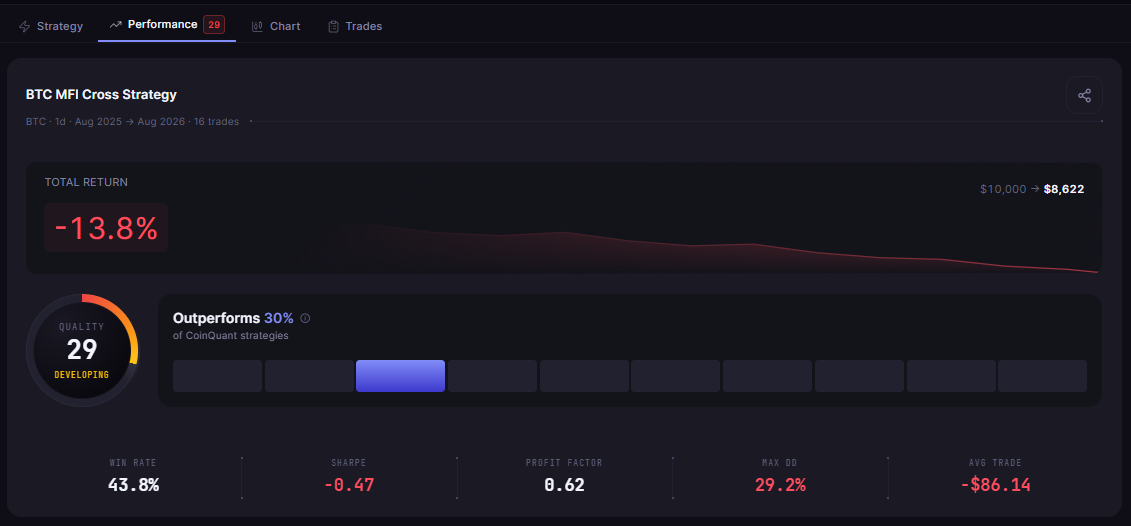
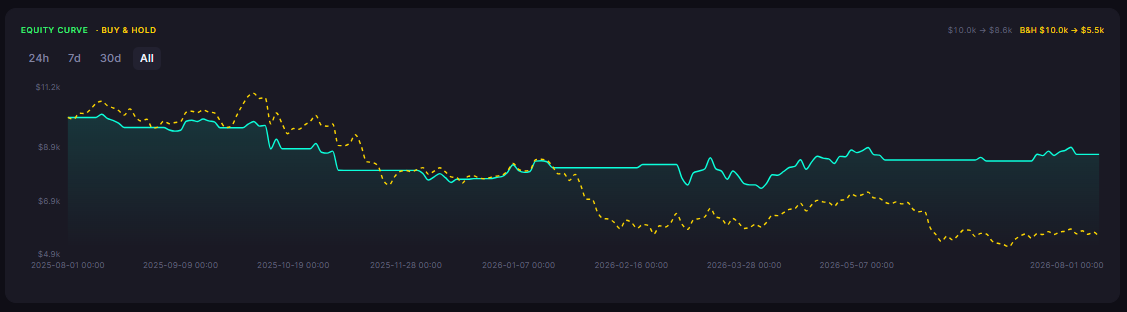
The daily midpoint cross produced 16 trades over the 12-month window with a total return of -13.78%. The win rate of 43.8% was the highest of the two strategies, and the max drawdown of 29.24% was contained relative to the loss.
| Metric | Result |
|---|---|
| Total Return | -13.78% ($10,000 to $8,622) |
| Total Trades | 16 |
| Win Rate | 43.8% |
| Profit Factor | 0.62 |
| Sharpe Ratio | -0.47 |
| Sortino Ratio | -0.65 |
| Calmar Ratio | -0.47 |
| Max Drawdown | 29.24% |
| Average Win | $319.24 |
| Average Loss | $401.44 |
| Best Trade | +$1,191.52 |
| Worst Trade | -$806.54 |
| Time in Market | 47.27% |
| Total Fees | $53.78 |
Result 2: Trend Confirmation on Four-Hour Bitcoin
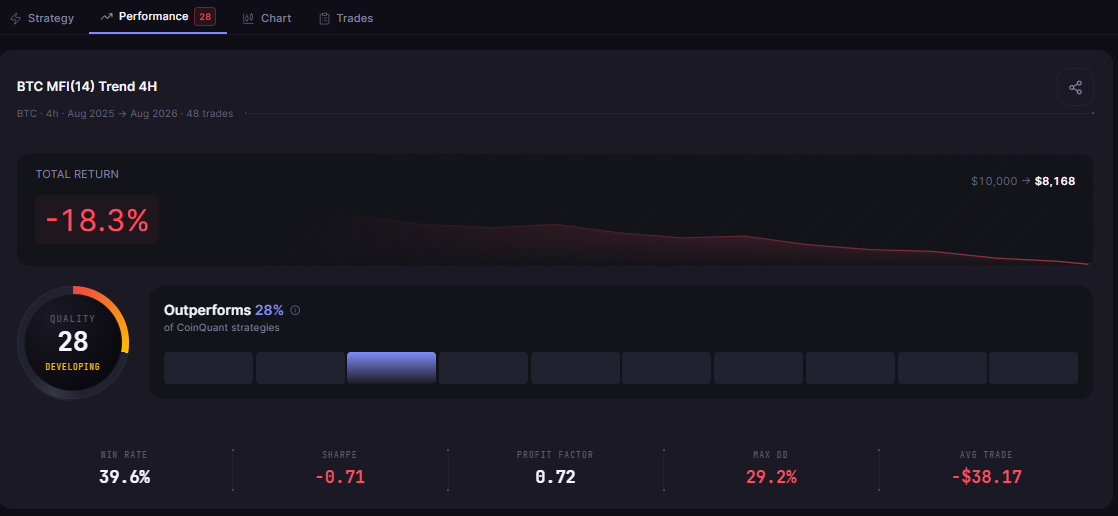
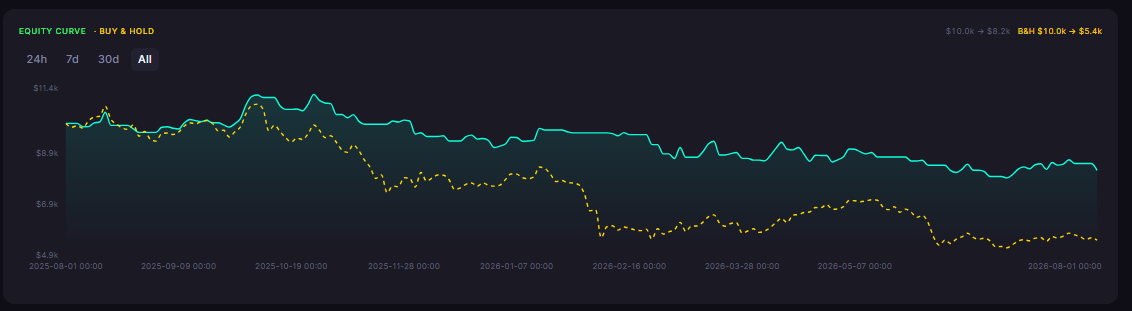
The four-hour trend strategy produced 48 trades with a total return of -18.32% and a max drawdown of 29.23%. The win rate of 39.6% was below the daily reading of 43.8%, and the profit factor improved to 0.72.
| Metric | Result |
|---|---|
| Total Return | -18.32% ($10,000 to $8,168) |
| Total Trades | 48 |
| Win Rate | 39.6% |
| Profit Factor | 0.72 |
| Sharpe Ratio | -0.71 |
| Sortino Ratio | -1.02 |
| Calmar Ratio | -0.63 |
| Max Drawdown | 29.23% |
| Average Win | $243.94 |
| Average Loss | $223.00 |
| Best Trade | +$1,154.33 |
| Worst Trade | -$562.02 |
| Time in Market | 48.79% |
| Total Fees | $177.89 |
Comparing the Two Strategies
| Strategy | Total Return | Total Trades | Win Rate | Max Drawdown | Sharpe | Profit Factor |
|---|---|---|---|---|---|---|
| BTC MoneyFlowIndex(14) Midpoint Cross 1D | -13.78% | 16 | 43.8% | 29.24% | -0.47 | 0.62 |
| BTC MFI(14) Trend 4H (enter 60 exit 40) | -18.32% | 48 | 39.6% | 29.23% | -0.71 | 0.72 |
Two findings stand out. First, neither configuration produced a positive return in this window. Second, the two strategies failed differently: the daily midpoint cross lost the least but with the lowest trade count, while the four-hour trend strategy traded three times as often and lost more in total, even though its profit factor was better.
Does a Money Flow Index Strategy Predict Trend Continuation?
The honest answer from this data: not in this market. Requiring MFI to cross above 60 on the four-hour chart produced a better profit factor (0.72 vs 0.62) than the neutral midpoint on the daily chart, but the higher trade count turned that better per-trade quality into a deeper total loss. The filter improved the signal without fixing the environment.
The comparison with the earlier MFI study is instructive. The related article on MFI 1D vs 4H midpoint crosses found the four-hour midpoint cross at 50 lost 26.6% over a similar window. The 60/40 threshold version tested here lost 18.3%, so the wider band did filter out a meaningful share of weak signals. But it did not make the strategy profitable, because volume-backed momentum was simply not sustained enough during a year of range-bound Bitcoin.
The Practical Lesson
For a trader evaluating a money flow index strategy on Bitcoin, the data says three things:
Timeframe dominates threshold: the daily strategy lost the least, matching the pattern found in the earlier MFI study
Threshold filters help but do not rescue: the 60/40 band improved profit factor and cut losses versus raw midpoint crossings
Volume-weighted momentum struggled in a range: neither strategy produced a positive edge over 12 months
The next experiments are obvious: test the 60/40 logic on the daily timeframe, test across a longer window that includes trending conditions, and add a trend filter such as price above the 200-period moving average. Each change needs its own backtest before it earns a place in a live strategy.
Disclaimer:
Key Takeaway
