
MFI Strategy on Bitcoin: What 1D vs 4H Backtest Data Reveals About Money Flow Timing
The Money Flow Index includes traded volume in its calculation, which sets it apart from oscillators like RSI that work on price alone. The standard argument for MFI is that a bullish price move accompanied by high volume is more credible than one driven by thin participation, and the MFI midpoint crossing at 50 attempts to capture that distinction in a single, actionable signal.
The practical question for a Bitcoin trader is whether MFI crossings of the 50-midpoint actually produce a positive edge, and whether the daily or four-hour timeframe gives a materially different outcome. This article answers both questions with backtest data from CoinQuant, covering August 3, 2025 to August 3, 2026. Fees and slippage are included in all results.
What the MFI Midpoint Cross Strategy Does
The Money Flow Index is a bounded oscillator scaled from 0 to 100. It is calculated by comparing the typical price across the lookback period, weighted by traded volume. Values above 80 conventionally indicate overbought conditions; values below 20 indicate oversold. The midpoint at 50 represents equilibrium between buying and selling pressure.
The midpoint cross strategy applies a mechanical interpretation:
Entry: Long when MFI(14) crosses above 50
Exit: Long when MFI(14) crosses back below 50
The 14-period lookback is the MFI default setting and the most widely referenced in technical analysis. A variant of the four-hour strategy was also tested, raising the entry threshold from 50 to 60 to require a stronger confirmation before entering. Results from both configurations are reported.
Test Setup
| Parameter | Value |
|---|---|
| Asset | BTCUSDT (Binance Spot) |
| Indicator | Money Flow Index (MFI), 14-period |
| Timeframes Tested | Daily (1D), Four-Hour (4H) |
| Test Window | August 3, 2025 to August 3, 2026 |
| Fees and Slippage | Included |
| Data Source | Kaiko via CoinQuant |
Daily vs Four-Hour: Head-to-Head Results
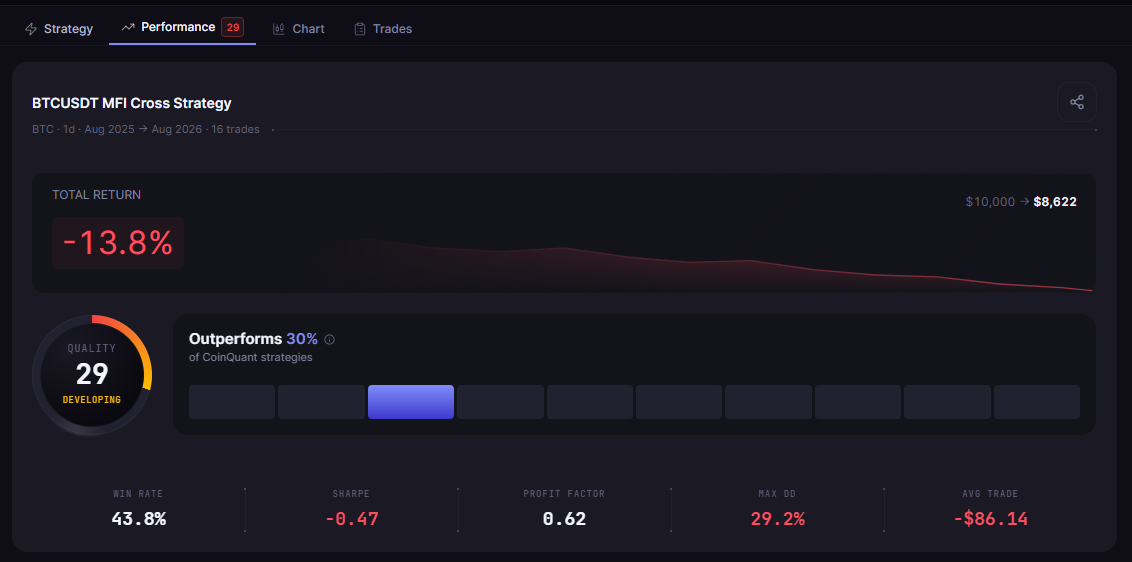
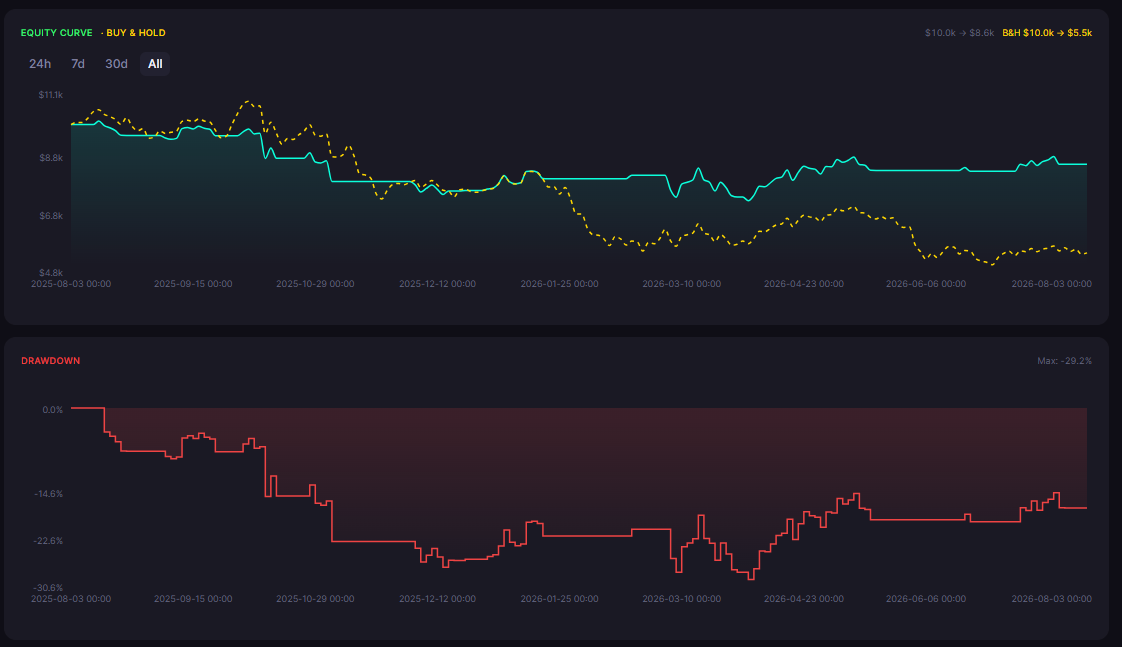
The daily strategy, "BTC MoneyFlowIndex(14) Midpoint Cross 1D," produced 16 trades over the 12-month window with a total return of -13.8%. The win rate of 43.8% is the highest across all configurations tested, and the maximum drawdown of 29.2% reflects a relatively contained loss pattern for a strategy that remained active throughout a choppy market.
The four-hour strategy, "BTC MFI(14) Midpoint Cross 4H," produced 108 trades over the same period. That is nearly seven times the trade count for the same signal logic on a lower timeframe. The higher frequency produced a lower win rate of 34.3% and a total return of -26.6%, nearly twice the loss of the daily strategy. The maximum drawdown of 28.4% was marginally narrower than the daily strategy despite the deeper total loss.
| Strategy | Total Return | Total Trades | Win Rate | Max Drawdown | Sharpe Ratio | Profit Factor |
|---|---|---|---|---|---|---|
| BTC MoneyFlowIndex(14) Midpoint Cross 1D | -13.8% | 16 | 43.8% | 29.2% | -0.47 | 0.62 |
| BTC MFI(14) Midpoint Cross 4H | -26.6% | 108 | 34.3% | 28.4% | -1.24 | 0.67 |
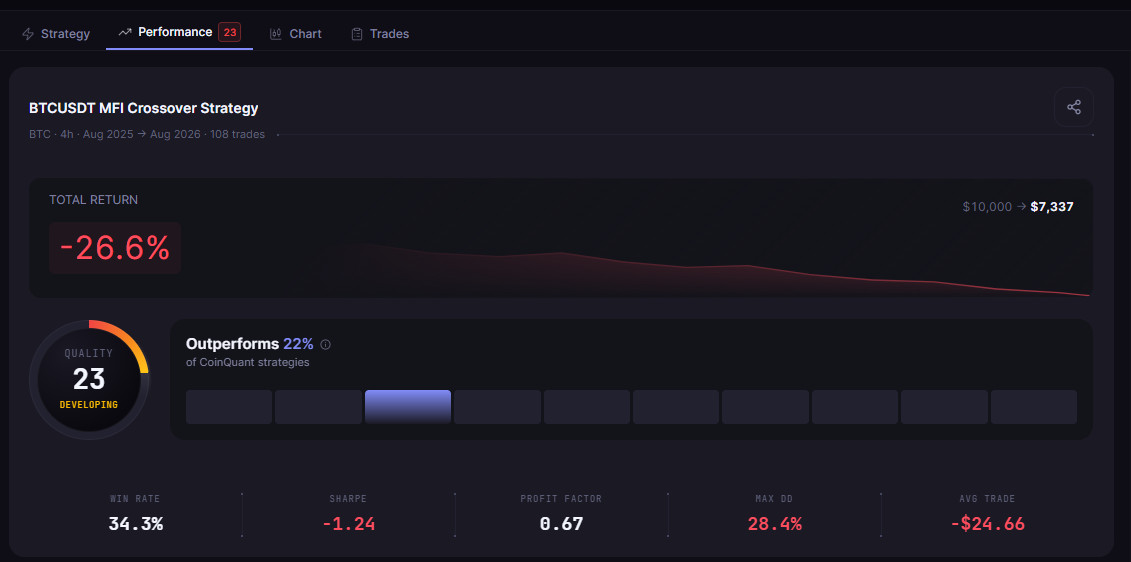
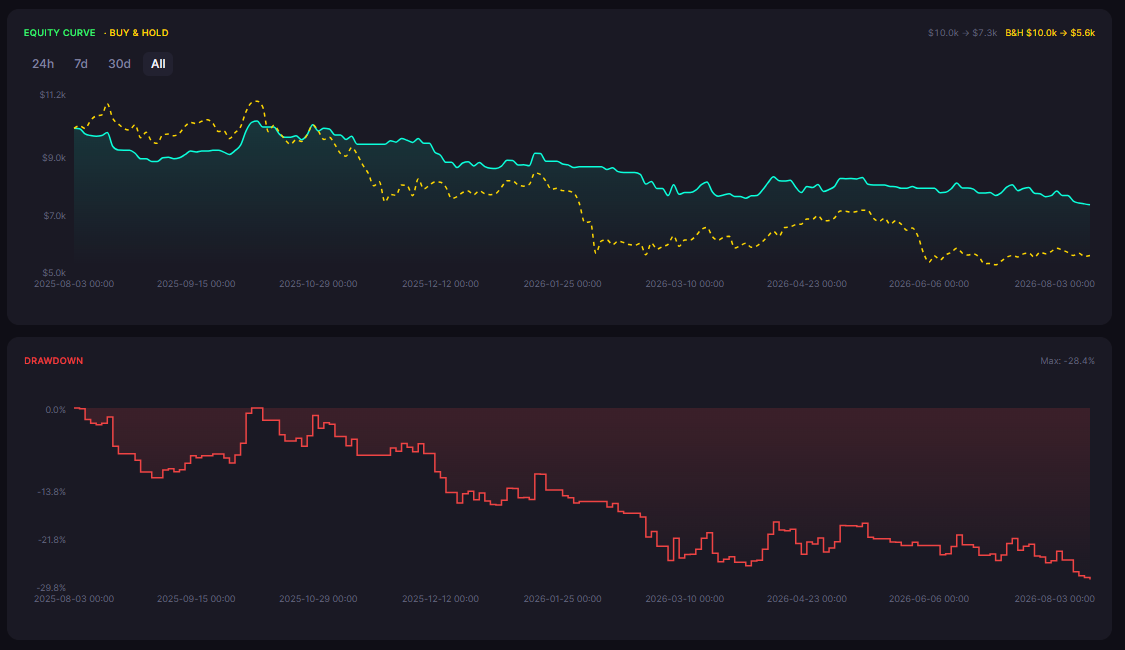
The 13-percentage-point gap in total loss between daily and four-hour is the article's central finding. It is explained in large part by the trade count: 108 four-hour trades in a range-bound market means 108 opportunities to enter on a false midpoint crossing and absorb a loss before the MFI reverses back below 50. The daily timeframe generates far fewer crossings, and each one carries more weight. Fewer, more deliberate entries translated directly into a better outcome.
Raising the 4H Entry Threshold
One variant was tested on the four-hour timeframe: requiring MFI to cross above 60 before entering (rather than 50), and holding until MFI drops below 40 rather than 50. This creates a filter band that rules out crossings near the midpoint where the signal is weakest.
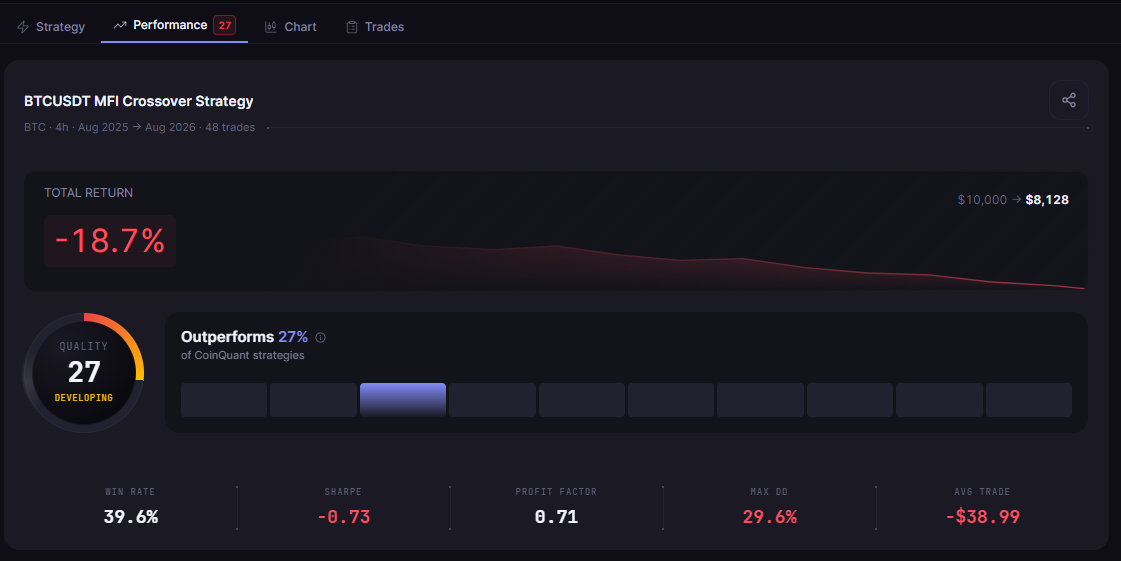
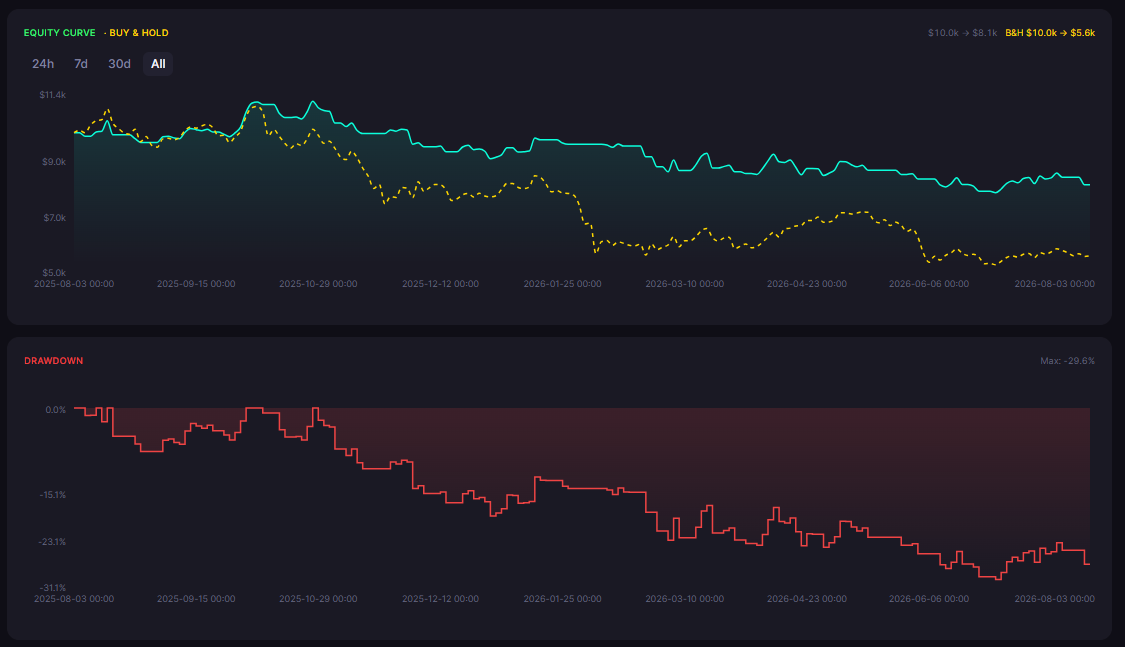
"BTC MFI(14) Trend 4H (enter 60 exit 40)" produced 48 trades, a win rate of 39.6%, and a total return of -18.7%, with a maximum drawdown of 29.6%.
| Strategy | Total Return | Total Trades | Win Rate | Max Drawdown | Sharpe Ratio | Profit Factor |
|---|---|---|---|---|---|---|
| BTC MFI(14) Midpoint Cross 4H | -26.6% | 108 | 34.3% | 28.4% | -1.24 | 0.67 |
| BTC MFI(14) Trend 4H (enter 60 exit 40) | -18.7% | 48 | 39.6% | 29.6% | -0.73 | 0.71 |
The higher threshold improved every measurable output: trade count dropped from 108 to 48, win rate rose from 34.3% to 39.6%, and total loss narrowed from -26.6% to -18.7%. The improvement confirms that four-hour MFI midpoint crossings at 50 were generating too many weak signals. Requiring a stronger reading before entry filtered out a meaningful portion of false positives.
What the Data Reveals About Money Flow Timing
The results from all three configurations point to a consistent conclusion: timeframe is the dominant variable in MFI midpoint cross performance during range-bound Bitcoin conditions.
The daily strategy outperformed both four-hour configurations by a significant margin. It generated 16 trades versus 48 or 108, maintained a win rate above 43%, and limited total loss to -13.8%. This advantage did not come from the MFI signal being fundamentally better on the daily chart. It came from signal frequency. In a market that was not trending strongly, a higher proportion of four-hour MFI crossings above 50 were noise rather than genuine momentum shifts.
Raising the four-hour entry threshold from 50 to 60 partially addressed this by filtering out weaker crossings, moving the total return from -26.6% to -18.7%. Neither four-hour configuration reached the daily result.
Neither the daily strategy nor either four-hour configuration produced a positive return during the test window. The August 2025 to August 2026 period for Bitcoin included prolonged range and consolidation phases, which are difficult conditions for momentum oscillators regardless of timeframe. MFI midpoint crosses generate their best signals when volume-backed momentum is sustained, and sustained momentum was limited during this window.
The Practical Lesson
The data tells a trader something specific and useful about MFI timing on Bitcoin.
When comparing daily versus four-hour MFI midpoint crosses during the past 12 months, the daily timeframe was materially less bad. Not profitable, but meaningfully better. The gap in total loss, 13 percentage points, is too large to attribute to randomness given the sample sizes involved.
For a trader evaluating MFI as part of a Bitcoin strategy, the timeframe selection matters more than the precise threshold setting. The four-hour chart at 60 is closer to the daily performance than the four-hour chart at 50, but neither four-hour variant reached the daily result. The clearest guidance the data provides: if an MFI midpoint cross strategy on Bitcoin is being considered, the daily timeframe has a substantially better recent track record than four-hour variants.
Running this backtest across a longer window that includes trending market conditions would provide a more complete picture of where MFI signal quality is highest.
Disclaimer:
Key Takeaway
