
Is One Year Carrying the Result? An XRP Trend Rule Split Year by Year (2021-2026)

Backtest results by year show whether a five-year number came from steady years or from one big one. We split XRP DEMA 20 Close Cross 1D 2021-2026 year by year. Over the full window it lost 21.23% across 162 trades, while holding XRP on the same window and fee returned 46.13%.
The split is sharper than the total. Only two exit years made money after fees: 2023 (+$516.11) and 2024 (+$7,915.45). One trade did more than any year: bought on 5 November 2024 and sold on 5 December 2024, it made $10,352.65 after fees, more than the strategy's whole 2024 net.
The author ran these backtests on CoinQuant, an AI trading platform, then grouped the trade log by year. This article reports the results without adjustment. No tuned parameters, no cherry picked dates.
Why a Five-Year Number Can Hide One Big Year
A five-year Total Return is one number at the end of one path. Many paths reach the same end: steady small gains, or years of losses rescued by one run.
- The total hides the order: a strategy can lose for three years and recover in one, or the reverse.
- The total hides concentration: if one year or one trade made all the money, the result depends on that stretch repeating.
- Holding a coin has the same problem: XRP's own yearly moves in this window ran from -59.15% in 2022 to +238.47% in 2024.
A year by year backtest split answers a simple question: did the rule earn its result across most years, or did one good year do the work?
The Rule and the Settings
This XRP trend strategy backtest follows the Double Exponential Moving Average (DEMA). CoinQuant's Supported Elements page describes it this way: "DEMA is a faster, smoother moving average that reacts to price changes more quickly than a normal EMA by reducing lag."
- Entry: buy XRPUSDT with 100% of equity when the daily close crosses above DEMA (period 20).
- Exit: sell when the daily close crosses below DEMA (period 20).
- Nothing else: no stop loss, no take profit, no filter, one position at a time.
| Parameter | Setting |
|---|---|
| Strategy | XRP DEMA 20 Close Cross 1D 2021-2026 |
| Instrument | XRPUSDT (spot, Binance) |
| Data source | Kaiko via CoinQuant |
| Timeframe | Daily (1D) |
| Tested window | 2021-08-01 to 2026-08-01 |
| First trade to last exit | 2021-08-18 to 2026-07-27 |
| DEMA settings | Period 20, on the close |
| Entry | Close crosses above DEMA(20) |
| Exit | Close crosses below DEMA(20) |
| Direction | Long only, no leverage |
| Initial capital | $10,000 |
| Position size | 100% of equity per entry |
| Fees | 0.1% on entry and 0.1% on exit (no slippage modelled) |
| Baselines (same window) | XRP Buy and Hold 1D 2021-2026; BTC Buy and Hold 1D 2021-2026 |
Data note: XRPUSDT daily data on CoinQuant is missing 2021-09-09 to 2021-09-15, and the platform does not flag the gap. No trade in this test spans it: one trade closed on 7 September 2021 and the next opened on 30 September 2021.
Buy and Hold Comparison on XRP
The baseline is XRP Buy and Hold 1D 2021-2026, a separate library strategy that buys on the first bar, holds to the end and pays the same 0.1% fee on entry and exit. BTC Buy and Hold 1D 2021-2026 is the BTC Spot Comparison.
| Metric | DEMA rule | XRP held | BTC Spot Comparison |
|---|---|---|---|
| Strategy | XRP DEMA 20 Close Cross 1D 2021-2026 | XRP Buy and Hold 1D 2021-2026 | BTC Buy and Hold 1D 2021-2026 |
| Total Return | -21.23% | 46.13% | 57.33% |
| Final Balance | $7,876.83 | $14,613.11 | $15,733.43 |
| Total Trades | 162 | 1 | 1 |
| Win Rate | 22.84% (37W / 125L) | n/a (single hold) | n/a (single hold) |
| Profit Factor | 0.94 | n/a (single hold) | n/a (single hold) |
| Sharpe Ratio | 0.18 | 0.49 | 0.44 |
| Max Drawdown | 75.91% | 77.87% | 76.63% |
| CAGR | -4.66% | 7.88% | 9.48% |
| Total Fees | $2,285.99 | $24.62 | $25.74 |
All three runs share the same window, capital, sizing and fee. CAGR is the steady yearly rate that would turn $10,000 into each final balance.
The DEMA rule trailed holding XRP on Total Return (-21.23% vs 46.13%), and its Max Drawdown was only slightly shallower (75.91% vs 77.87%). It was in the market 49.12% of the time, so stepping aside half the time did not spare it a deep fall.
Each Buy and Hold card shows its QUALITY number next to "Statistically inconclusive" (1 trade · needs 50+ to rate): 57 for XRP and 56 for BTC. A single hold is one trade by design. The DEMA rule's card shows 162 trades, -21.2% and a QUALITY of 30 next to its "Outperforms" box.
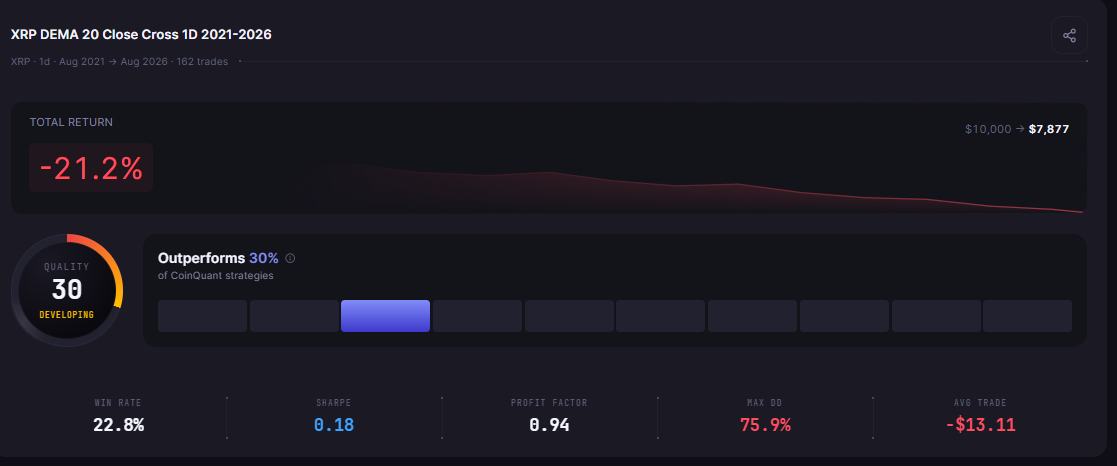
XRP DEMA 20 Close Cross 1D 2021-2026: five years of daily XRP, 162 trades, -21.2%, $10,000 to $7,877, QUALITY 30.
Backtest Results by Year: Trades, Wins and Net Result
Here is the split. Each closed trade counts in the year of its exit date (UTC), and the net is after fees. The last column is XRP Buy and Hold 1D 2021-2026: the change in its balance from one end of year daily close to the next.
| Exit year (UTC) | Trades | Wins | DEMA rule net, after fees | XRP Buy and Hold, year change |
|---|---|---|---|---|
| Strategy | XRP DEMA 20 Close Cross 1D 2021-2026 | XRP DEMA 20 Close Cross 1D 2021-2026 | XRP DEMA 20 Close Cross 1D 2021-2026 | XRP Buy and Hold 1D 2021-2026 |
| 2021 (from 1 Aug) | 12 | 5 | -$1,308.85 | +14.45% |
| 2022 | 39 | 7 | -$4,893.17 | -59.15% |
| 2023 | 27 | 5 | +$516.11 | +81.65% |
| 2024 | 33 | 8 | +$7,915.45 | +238.47% |
| 2025 | 32 | 8 | -$2,952.58 | -11.58% |
| 2026 (to 1 Aug) | 19 | 4 | -$1,400.12 | -42.50% |
| All years | 162 | 37 | -$2,123.17 | +46.13% |
The six yearly nets add up to the run's result, $10,000 to $7,876.83 or -$2,123.17 (the rounded yearly figures sum to one cent less). Note the units: dollars for the rule's closed trades, percent for the holder's balance.
One Year, and One Trade, Carried It
This is what a one good year backtest looks like: 2024 was the only big year, and one trade made it. The trade from 5 November to 5 December 2024 made $10,352.65 after fees, so the other 32 trades that closed in 2024 lost money between them.
Outside 2024, the rule made money only in 2023, and only $516.11. Holding XRP shows the same dependence: its +238.47% in 2024 did most of the work for the whole +46.13%.
Dollar Nets Depend on the Balance
The rule sized every trade at 100% of equity, so a dollar net reflects the balance at the time. After the 2022 losses, 2024 began with less than half of the starting $10,000, which makes its $7,915.45 gain larger than it looks.
The year boundary matters for the split. Order row 24 is an Exit on 28 December 2021 and row 25 is the next Entry, on 2 January 2022, so that pair of trades lands in two different years.
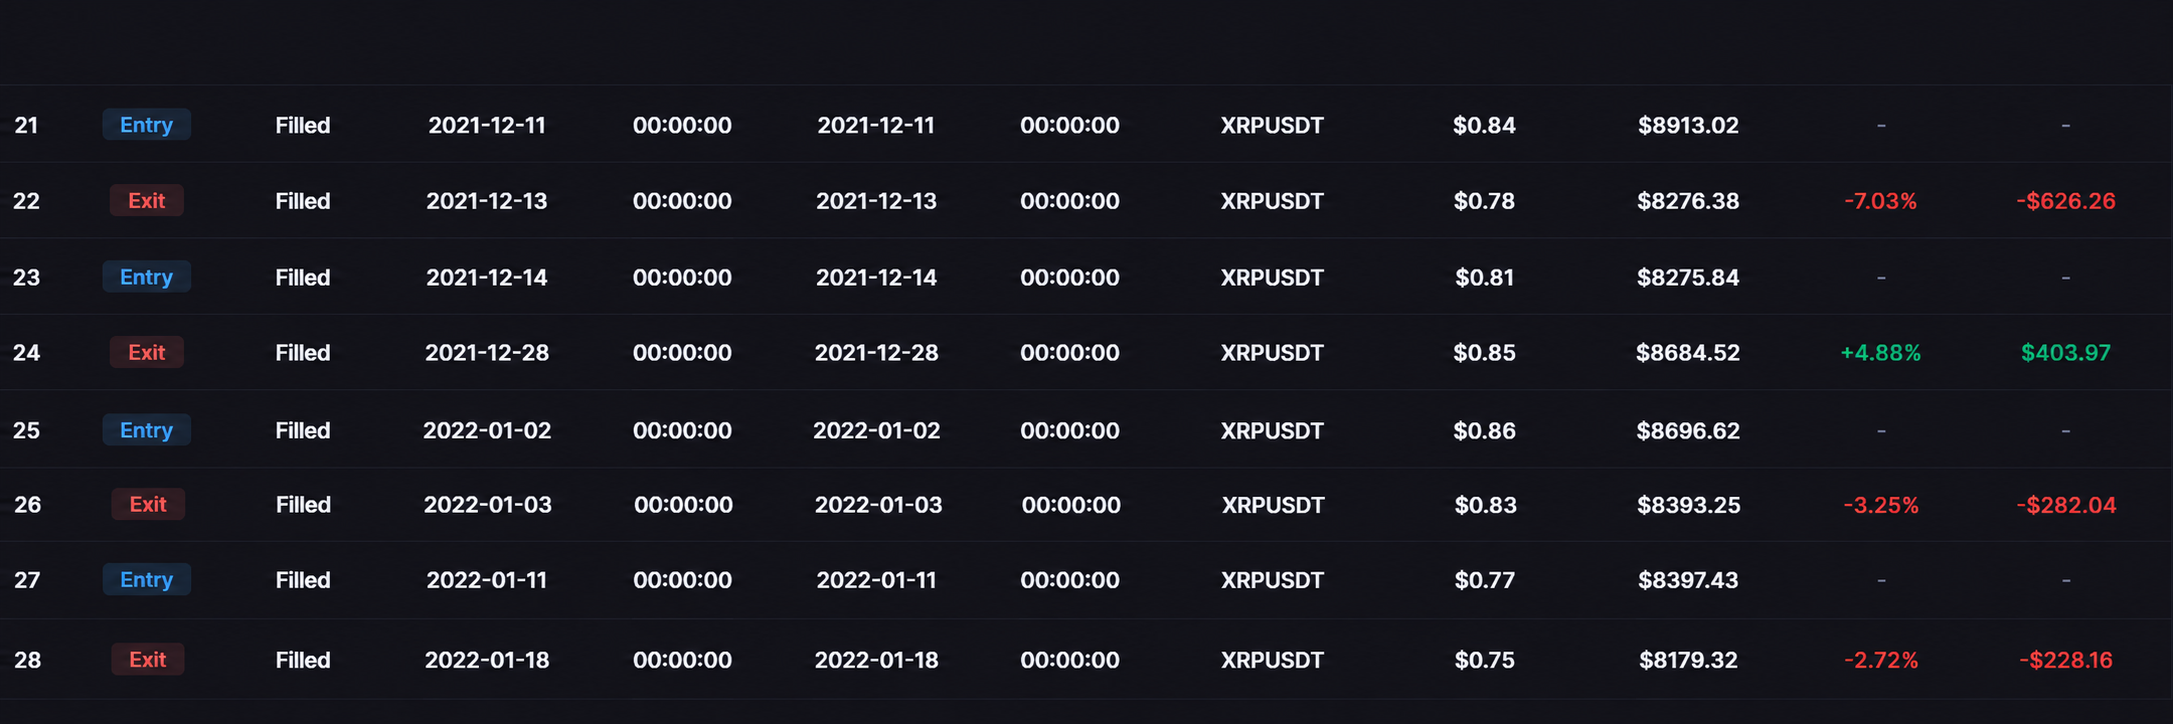
Order rows on either side of the 2021 to 2022 year boundary (UTC): row 24 is a Filled Exit on 28 December 2021 and row 25 a Filled Entry on 2 January 2022.
How to Run the Split on Your Own Trade Log
You can repeat this check on any backtest in a few minutes.
- Export the log: open the Trades tab and download the CSV. Each trade is two order rows, an Entry and an Exit, in UTC.
- Keep the exits: the Net PnL of each Exit row is that trade's result after fees.
- Group by exit year: sum the Net PnL and count the wins for each year.
- Label part years: a window from 1 August to 1 August has a short first and last year.
- Reconcile: the yearly nets should add up to the final balance minus the starting capital.
Pick one grouping and state it. Grouping by entry year moves trades that span a New Year. Here, a winning trade opened on 26 December 2025 and closed on 10 January 2026, so by entry year 2025 has 33 trades and -$1,730.77, and 2026 has 18 trades and -$2,621.94.
What This Test Cannot Tell You
A year by year split is a check, not a forecast. Keep these limits in view:
- Scope: one coin, one rule (DEMA period 20), one window, daily bars.
- Part years: 2021 starts on 1 August and 2026 ends on 1 August.
- Costs: a 0.1% fee on every fill and no slippage modelled.
- Data gap: XRPUSDT daily data is missing 2021-09-09 to 2021-09-15.
For how many trades a result needs, read how many trades a backtest needs before you can trust it. For why a yearly rate and a total tell different stories, see CAGR vs Total Return. For another XRP rule read through one dated event, see the XRP Aroon stress test around the October 10, 2025 crash.
The Practical Lesson
- Split before you trust: the rule lost 21.23% over five years, and only 2023 and 2024 made money after fees.
- Look for the one trade: $10,352.65 from a single trade in late 2024 was more than the whole year's net.
- Check the benchmark the same way: holding XRP also leaned on 2024 (+238.47%).
In CoinQuant you can describe a rule in plain English, backtest it on five years of daily data, then export the Trades tab and run the split yourself.
Build trading strategies on real data. No coding required.
Frequently Asked Questions
How do I see backtest results by year?
Export the trade log, keep the Exit rows and group their Net PnL by the year of the exit date. Label part years, and check that the yearly sums add up to the final balance minus the starting capital.
Is one good year enough to trust a strategy?
No. In this test, 2024 made $7,915.45 after fees and one trade made $10,352.65, while four of the six exit years lost money. A result that rests on one year or one trade depends on that stretch repeating.
What is a DEMA crossover?
A DEMA crossover buys when price crosses above the Double Exponential Moving Average and sells when it crosses back below. CoinQuant's Supported Elements page describes DEMA as reacting to price changes more quickly than a normal EMA.
Split your own five-year result before you trust it.
Disclaimer:
Key Takeaway