
How to Read a Drawdown Chart: Depth, Length and Recovery
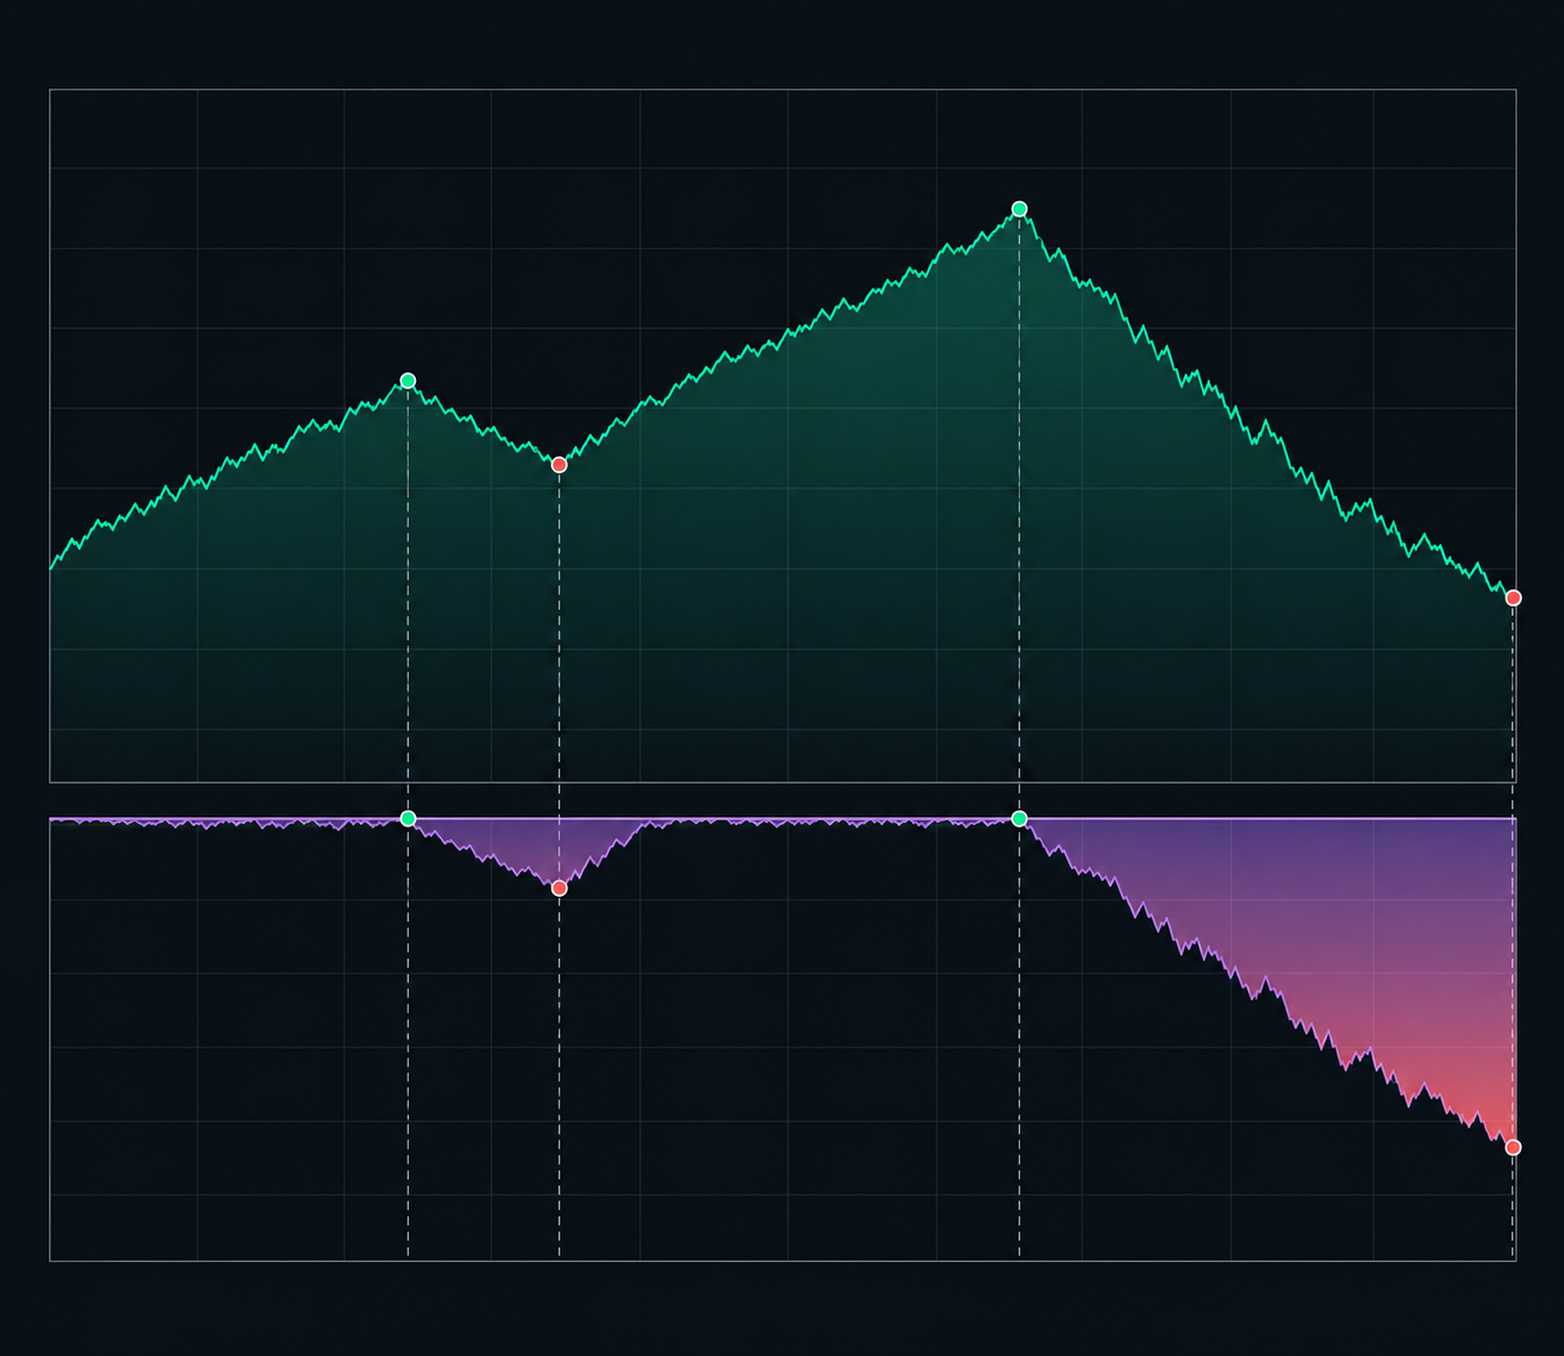
Read three things: how deep it went, how long it stayed below the old high, and whether it came back. In CoinQuant's backtest of holding Bitcoin from 1 Aug 2024, a 28.10% drawdown recovered in 117 days, while the deepest, 52.97% from the 6 Oct 2025 high, was still open after 299 days.
That is how to read a drawdown chart in three questions. A drawdown is the fall from the highest value an account has reached so far. Depth is the number most people quote, but length and recovery decide how hard a drawdown is to sit through.
This guide reads the DRAWDOWN card on the Performance tab of CoinQuant, an AI trading platform, with one real example: BTC Buy and Hold 1D 2024-2026, which buys Bitcoin on 1 August 2024 and holds it to 1 August 2026.
The Answer First: Depth, Length, Recovery
Each drawdown on the chart answers three questions:
- Depth: how far the account fell below its old high, in percent.
- Length: how many days it stayed below that high, until it got back or until the test ended.
- Recovery: whether the line came back to zero, and on what date.
Here are the two largest drawdowns in the example, read from the backtest's saved drawdown curve:
| Drawdown | Old high (daily close) | Lowest point | Depth | Back at the old high | Days below the old high |
|---|---|---|---|---|---|
| First | 21 Jan 2025 | 8 Apr 2025 | 28.10% | 18 May 2025 | 117 |
| Second | 6 Oct 2025 | 30 Jun 2026 | 52.97% | Not by 1 Aug 2026 | 299, to the end of the test |
The first is a finished drawdown: deep, then over in under four months. The second is deeper, longer and still open when the test ends.
What the DRAWDOWN Card Shows (and the "All" Range)
On a CoinQuant backtest, the Performance tab shows the results card and the Detailed Statistics first. Below them sit two cards: the equity card, labelled EQUITY CURVE · BUY & HOLD, and the DRAWDOWN card. The drawdown card is built from the equity line, so start there.
The example is the simplest rule there is. Typed into CoinQuant in plain English, it reads:
Buy BTCUSDT on the daily chart on the first day of the test with the full balance and hold it to the end. Test from August 1, 2024 to August 1, 2026, with the trading fee on entry and exit.
The equity card's B&H line is the platform's Buy and Hold benchmark, which carries no fees. The library strategy BTC Buy and Hold 1D 2024-2026 pays the trading fee on entry and exit, so the two lines sit almost on top of each other. The two falls on the equity curve are the two drawdowns in the table above.
The DRAWDOWN card turns that curve into one number per day: how far equity sits below its highest value so far. At a new high the line sits at zero. The top right "Max" label shows the deepest point of the whole window, here Max: 52.97%.
Keep the "All" range selected. A shorter range can cut off the old high, so you cannot see where a drawdown started or count its length. For the shapes an equity curve can take, see How to Read an Equity Curve: What the Shape of a Backtest Tells You.
Two Real Drawdowns on One Card
The first drawdown started at the high of 21 January 2025. Valued at each daily close, the account fell for 77 days to its lowest point on 8 April 2025, 28.10% below that high. It then took 40 days to climb back, and the line touched zero again on 18 May 2025: 117 days in all.
The second started at the high of 6 October 2025. This time the fall lasted 267 daily closes, to a low of 52.97% on 30 June 2026. When the test ended on 1 August 2026 the account was still about half below that high, 299 days after it.
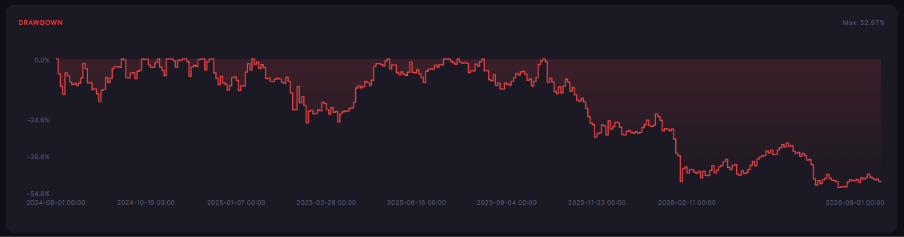
Drawdown of BTC Buy and Hold 1D 2024-2026, August 2024 to August 2026: Max: 52.97%, with the 2025 to 2026 fall still open at the right edge of the chart.
The saved curve holds 22 separate drawdowns in these two years. Most are small dips that close within days or weeks. Only these two last longer than two months, and they look very different: the first is a sharp dip with a fast recovery, the second a long slide with none. The single number that defines the worst one is covered in Maximum Drawdown in Crypto Trading: How to Read It and Why It Matters More Than Returns.
When the Worst Drawdown Is Still Open
An open drawdown has no recovery date yet. Count its days from the old high to the last daily close of the window, and say that it is still open: "52.97%, 299 days, not recovered by 1 August 2026" is a full reading.
Note how far apart two numbers can be. Over the whole test the account lost only 4.06%, ending at $9,593.61. Yet it sat 52.97% below its high at the worst point, because a drawdown counts from the highest value, not from the start.
The backtest ends on 1 August 2026, so it cannot show whether this drawdown has closed since. Whether a long drawdown means a rule has stopped working is a separate question, covered in Drawdown or Broken Strategy? How to Decide When to Stop Trading a Crypto Strategy.
How to Read a Drawdown Chart of Your Own: Four Questions
- Depth: how deep did it go? Read the Max label, then find the date of that low on the chart.
- Length: how long did it last? Count the days from the old high to the day the line returns to zero.
- Recovery: did it come back? If the line is still below zero at the right edge, the drawdown is open; give its days to the end of the window.
- Benchmark: how does it compare on the same window? Run the same coin's buy and hold over the same dates and read its chart the same way.
The example here is itself a buy and hold run with a single trade. Its results card marks it "Statistically inconclusive", because it needs 50+ trades to rate, and shows QUALITY 19 next to that label. It is used here to read the chart, not to rate a rule. To weigh return against drawdown in one figure, see Total Return vs Return to Drawdown: Which Number Ranks Crypto Strategies Better?.
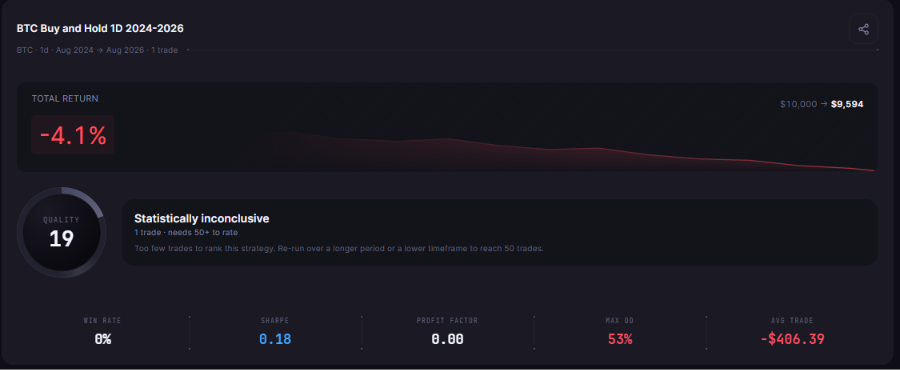
BTC Buy and Hold 1D 2024-2026, tested from August 2024 to August 2026: one trade, -4.1%, $10,000 to $9,594 and QUALITY 19 next to "Statistically inconclusive".
Common Mistakes When Reading a Drawdown Chart
- Reading only the Max label: it gives the depth of one point, not how long the fall lasted.
- Measuring from the start of the test: the example lost 4.06% overall but sat 52.97% below its high.
- Using a short range: the old high can fall outside the chart.
- Calling an open drawdown finished: if the line has not returned to zero, there is no recovery date to quote.
The Practical Lesson
- Read depth, length and recovery together: each tells you something the others do not.
- Count days below the old high: a shallow drawdown that lasts a year can be harder to sit through than a deep, short one.
- Say when a drawdown is still open: give its days to the end of the window.
Before you trust a backtest, open its DRAWDOWN card with "All" selected and write down the depth, length and recovery of its two worst drawdowns. Then do the same for Buy and Hold on the same coin and dates.
Build trading strategies on real data. No coding required.
Frequently Asked Questions
What is a good Max Drawdown?
There is no single good number. Compare a rule's Max Drawdown with buy and hold on the same coin and window, and read how long it lasted. In this example, buying Bitcoin on 1 August 2024 meant a 52.97% drawdown that was still open after 299 days.
How long does a drawdown take to recover?
It varies, and some do not recover inside the test. In this backtest, a 28.10% drawdown took 117 days from the old high to recovery, while the 52.97% drawdown had not recovered after 299 days.
What does "time under water" mean?
It is the time an account spends below its previous high, the length of a drawdown. On the DRAWDOWN card it is the stretch where the line stays below zero.
Read the drawdown card of any backtest before you trust its return.
Disclaimer:
Key Takeaway