
Drawdown or Broken Strategy? How to Decide When to Stop Trading a Crypto Strategy

Knowing when to stop trading a strategy comes down to one test: is the current losing stretch inside the range the backtest already showed you, or outside it? A drawdown inside that range is the normal cost of the strategy. A drawdown outside it, or an edge that has faded on fresh data, is a reason to stop.
The question usually arrives the same way: the strategy made money for a year and now it is losing. This guide gives you a framework to answer it. Set expectations from the backtest, watch a short list of signals and re-test before you quit. One real Strategy Library result shows why the order matters.
Drawdown vs Decay
A drawdown is a fall from a previous equity peak, and every strategy has them. Strategy decay is different: the market behaviour the rules relied on has changed, so the edge itself is shrinking.
| Question | Normal drawdown | Strategy decay |
|---|---|---|
| How deep is the fall? | Within the backtest's max drawdown | Beyond it |
| How long is the losing streak? | Within the backtest's longest streak | Longer |
| Win rate and profit factor over many trades | Close to the backtest | Clearly lower, and staying lower |
| Trade frequency | Similar to the backtest | Far higher or lower than expected |
| Fresh re-test on recent data | Looks like weak stretches already in the backtest | Worse than anything in the backtest |
The drawdown vs broken strategy decision is a comparison, not a feeling. You need the backtest's numbers first.
Set Expectations From the Backtest
BTC Relative Volatility Index Cross 1D 2021-2026 is a useful case because it tells two stories. It buys BTCUSDT when the Relative Volatility Index (period 10) crosses above 50 and exits when it crosses below.
The test used Binance spot data from Kaiko via CoinQuant, daily bars from August 1, 2021 to August 1, 2026, $10,000, 100% of equity per trade and a 0.1% taker fee. No slippage was set.
| Metric | Strategy | Buy and Hold |
|---|---|---|
| Strategy | BTC Relative Volatility Index Cross 1D 2021-2026 | BTC Buy and Hold 1D 2021-2026 |
| Total Return | -40.09% | +57.33% |
| Final balance | $5,991.02 | $15,733.43 |
| Total Trades | 203 | 1 |
| Win Rate | 23.15% | n/a (single hold) |
| Profit Factor | 0.86 | n/a |
| Max Drawdown | 60.37% | 76.63% |
| Longest losing streak | 16 trades | n/a |
| Sharpe Ratio | -0.14 | 0.44 |
Read the trade log by year and the familiar story appears. Grouped by exit date, closed trades lost money in 2021 (from August) and 2022, then made money in 2023 and 2024. Then came 16 straight losses between December 2024 and April 2025, and closed trades lost money again in 2025 and in 2026 up to the August 1 end of the test.
A trader who started in 2023 would ask whether it broke. The full backtest gives a different answer: over the whole window its profit factor was 0.86, so there was never an edge to lose. The two profitable years sat inside a losing whole, so they were never evidence of a durable edge.
That is the first lesson: confirm there was an edge before asking whether it broke. For a strategy that does have one, the same results panel gives you the limits to monitor. Here they are a 60.37% max drawdown and a 16-trade losing streak.
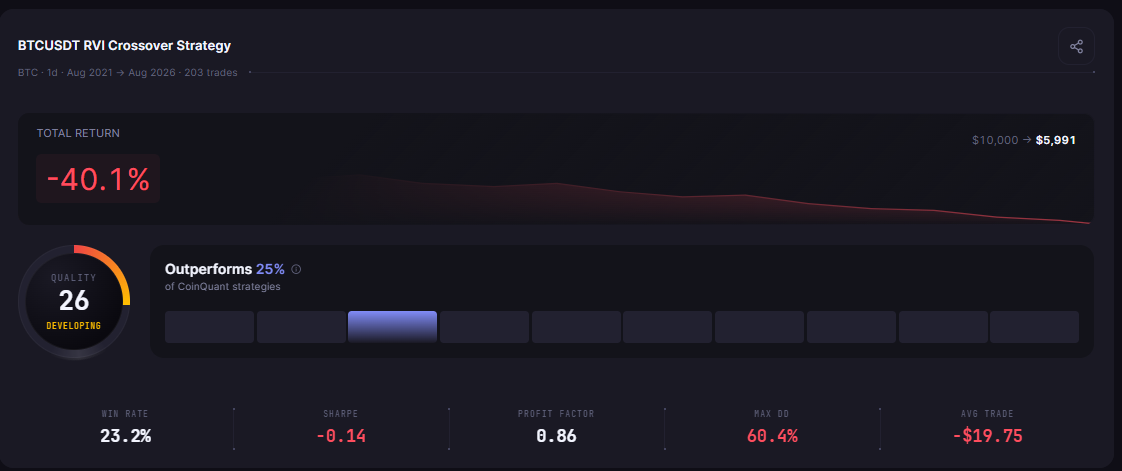
BTC Relative Volatility Index Cross 1D 2021-2026 finished at -40.09% after 203 trades, with a 60.37% max drawdown to use as a monitoring limit.
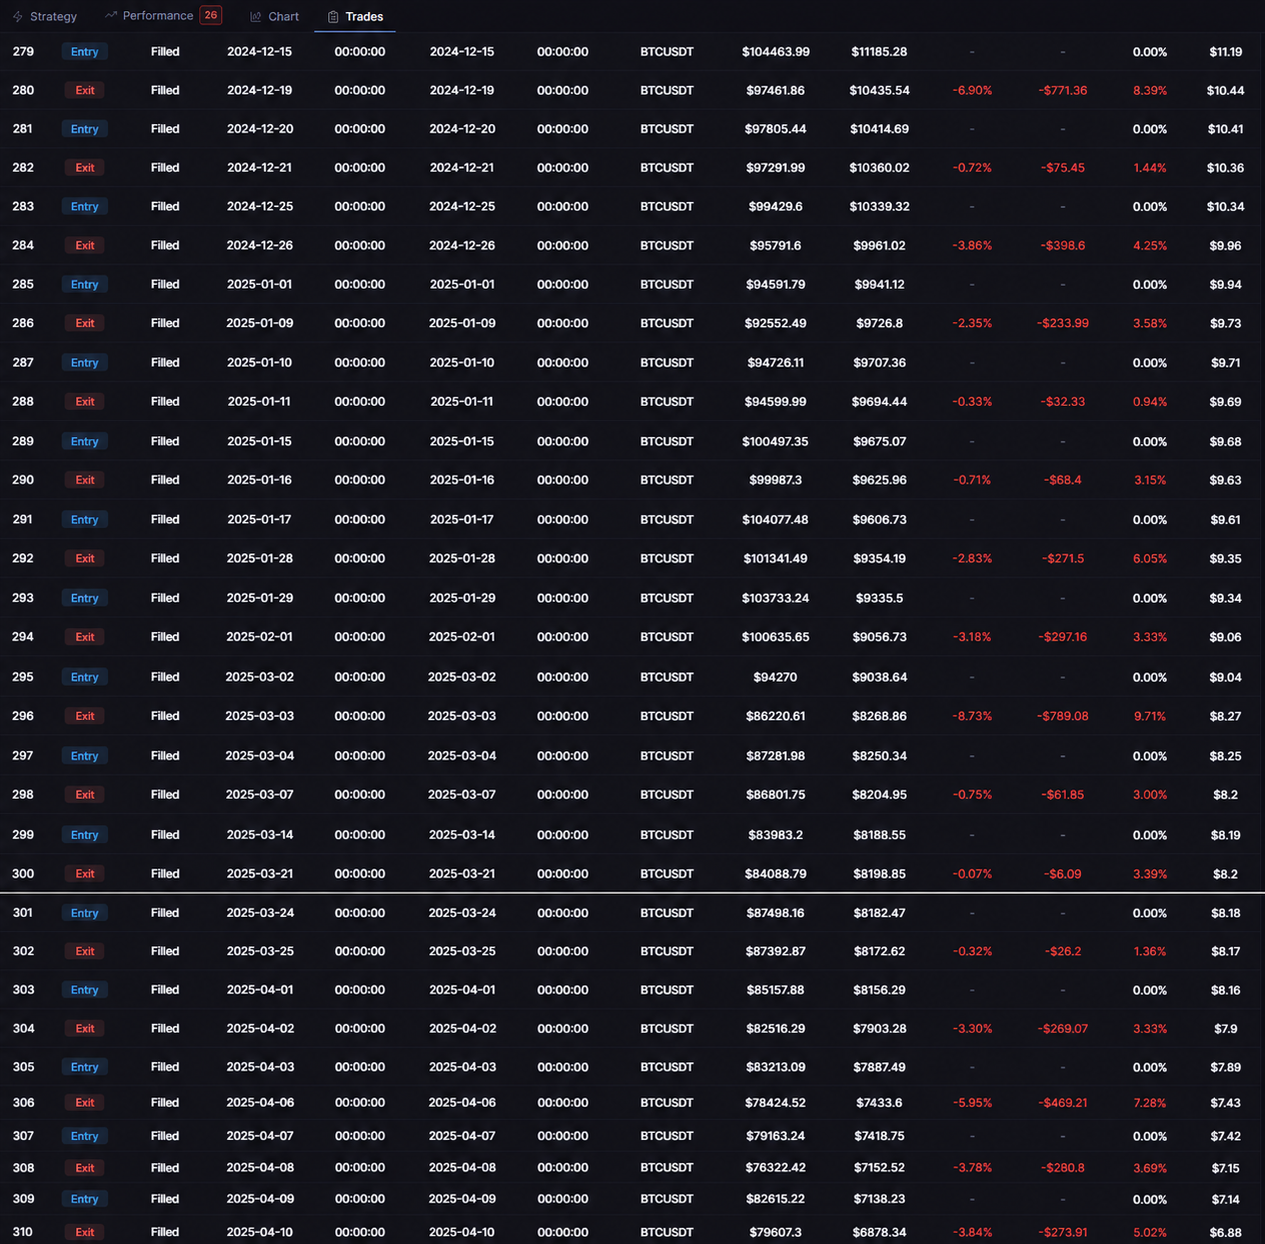
BTC Relative Volatility Index Cross 1D 2021-2026: 16 straight losing trades between December 2024 and April 2025, the longest losing streak in the backtest.
Screenshot from the author's CoinQuant account. Backtest results are hypothetical, based on historical data with modelled fees, and do not guarantee future performance. Not financial advice.
When to Stop Trading a Strategy: The Signals to Watch
Once you have the backtest's limits, how to monitor a trading strategy becomes a checklist. These signals suggest a trading strategy stopped working rather than just stumbled. Treat the thresholds as general guidance, not fixed rules:
| Signal | Backtest reference | What to do |
|---|---|---|
| Drawdown deeper than the backtest's worst | Max Drawdown | Pause and re-test |
| Losing streak longer than the backtest's longest | Longest losing streak | Pause and re-test |
| Win rate and profit factor clearly below the backtest over 30 or more trades | Win Rate, Profit Factor | Re-test on a recent window |
| Trades arriving far more or less often than in the backtest | Total Trades over the window | Check whether the market has changed |
| Real fees higher than the modelled fee | Fee setting | Re-run with your real fee |
| The market regime the rules need has gone | Periods the strategy made money | Re-test in the new regime |
Write these limits down before you start trading a strategy. A rule set in advance is far easier to follow than one invented in the middle of a drawdown. For the regime question, see understanding market regimes.
Re-Test Before You Quit
When a signal fires, do not delete the strategy. Re-test it:
Re-run the unchanged strategy on the most recent window, for example the last 12 months, with the same fees and sizing.
Compare it with the full-window result: win rate, profit factor, max drawdown and trade count.
Check the benchmark. The Buy & Hold line on the same chart shows whether the whole market was hard or only your strategy.
Look for a similar stretch in the full backtest. If the full test already contains a period this bad, you are probably inside normal variance.
Decide by your written rules: continue, reduce size, pause or stop.
For example, a recent-window re-test can be typed into CoinQuant in plain English:
Buy BTCUSDT on the daily chart when the Relative Volatility Index (period 10) crosses above 50. Sell when it crosses below 50. Test from August 1, 2025 to August 1, 2026 with $10,000, 100% of equity per trade and a 0.1% fee.
Common mistakes
Quitting inside the range. Stopping at the first painful drawdown that the backtest already showed was normal.
Holding past every limit. "It came back last time" is not a rule.
Re-tuning to the last few months. Strategy decay is not fixed by fitting settings to recent data.
Judging on a handful of trades. A few live trades cannot confirm or reject a backtest.
Before a strategy goes live, the checks in how to know if a crypto trading strategy will work apply. For why live results drift from backtests, see six real reasons backtested strategies fail live and the performance gaps most traders miss.
The Practical Lesson
Check for an edge first. A profit factor below 1.0 over the full window means there is nothing to decay.
Take your limits from the backtest. Max drawdown and the longest losing streak define normal.
Watch a short list of signals and write the stop rules down in advance.
Re-test before you quit, on a recent window with the same settings, against the Buy & Hold line.
CoinQuant, the AI trading platform, makes the re-test a plain-English change of dates rather than a rebuild. Build trading strategies on real data. No coding required.
Re-test your strategy on a recent window before you decide. Backtest your strategy free
Disclaimer:
Key Takeaway
