
Holding Solana Meant a 96% Drawdown in 2021-2026: Can a Trend Rule Keep You Out of the Worst Falls?

Holding Solana from 2021 to 2026 more than doubled $10,000, but on the way it fell 96.27% from its high. We tested a Solana drawdown trend strategy, a simple Aroon crossover rule, to see whether it kept a holder out of the worst of that fall.
It helped less than you might hope. The rule cut the worst fall to 76.72%, but it lost $5,496.70 after fees on the 18 trades it held during the fall, and over five years it returned 0.78% against 110.02% for holding.
The author ran both backtests on CoinQuant, an AI trading platform, on Binance spot daily data from 2021-08-01 to 2026-08-01, with fees included on entry and exit. The results are reported without adjustment.
A 96% Drawdown in Plain Numbers
SOL Buy and Hold 1D 2021-2026 puts $10,000 into Solana on the first day and holds it. It ended at $21,002.12, a Total Return of 110.02%. The path is the problem:
- Peak: the highest daily close came on 2021-11-06.
- Low: the lowest close came on 2022-12-29, a Max Drawdown of 96.27%.
- Recovery: the holding was back at its peak on 2025-01-18.
In plain words, a holder who bought at the top kept less than four cents of every dollar at the low. Getting back needed the price to grow more than 26 times over, and it took just over two years from the low, more than three years from the peak.
Solana fell again from 12 to 26 October 2026 on Binance spot daily candles, which keeps the question alive. That move falls outside the backtest window, which closes on 1 August 2026. For how a rule behaves through a single sharp drop, see how a trend strategy handled the October 10, 2025 crash on XRP.
The Solana Drawdown Trend Strategy: Rule and Settings
The rule uses the Aroon indicator. Aroon Up scores how few days have passed since the highest high of the last 14 days, and Aroon Down does the same for the lowest low. When Aroon Up crosses above Aroon Down, the last 14-day high came after the last 14-day low, which reads as an uptrend.
As stored, the strategy enters long when Aroon Up (14) crosses above Aroon Down (14) and exits when Aroon Up (14) crosses below Aroon Down (14). There is no stop and no target.
| Parameter | Setting |
|---|---|
| Strategy | SOL Aroon 14 Cross 1D 2021-2026 |
| Asset and exchange | SOLUSDT, Binance spot |
| Timeframe | 1D |
| Period | 2021-08-01 to 2026-08-01 |
| Capital and size | $10,000, 100% of equity, one position at a time, long only |
| Fees | 0.1% on entry and 0.1% on exit; no slippage modelled |
| Data source | Kaiko via CoinQuant |
Buy and Hold Comparison on Solana
Here is the rule against holding Solana, with holding Bitcoin over the same window as the BTC Spot Comparison:
| Metric | Aroon rule | SOL Buy and Hold | BTC Spot Comparison |
|---|---|---|---|
| Strategy | SOL Aroon 14 Cross 1D 2021-2026 | SOL Buy and Hold 1D 2021-2026 | BTC Buy and Hold 1D 2021-2026 |
| Total Return | 0.78% | 110.02% | 57.33% |
| Final Balance | $10,077.61 | $21,002.12 | $15,733.43 |
| Total Trades | 64 | 1 | 1 |
| Win Rate | 39.06% | n/a (single hold) | n/a (single hold) |
| Profit Factor | 1.00 | n/a (single hold) | n/a (single hold) |
| Sharpe Ratio | 0.30 | 0.64 | 0.44 |
| Max Drawdown | 76.72% | 96.27% | 76.63% |
| Total Fees | $1,897.93 | $31.01 | $25.74 |
The rule trailed holding Solana by a wide margin and finished almost flat. Its worst fall was shallower than holding Solana's, but about as deep as holding Bitcoin's, and Bitcoin returned 57.33% with a single trade.
A Profit Factor of 1.00 means the winners and losers almost cancelled out: 25 wins and 39 losses across 64 trades. The two holds are single trades, so their cards show their QUALITY numbers next to "Statistically inconclusive"; the rule's 64 trades are enough for the card to rate it.
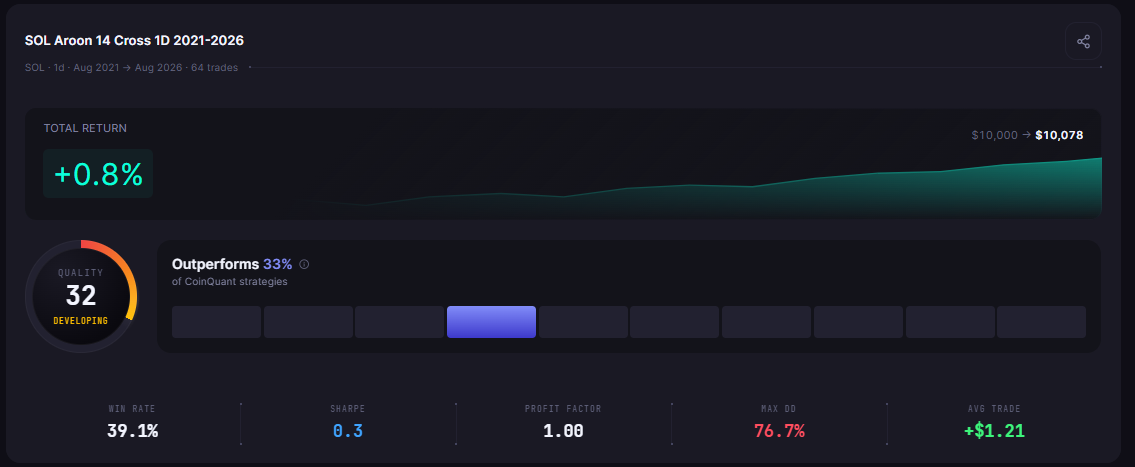
SOL Aroon 14 Cross 1D 2021-2026 over five years of daily SOL: 64 trades, +0.8%, $10,000 to $10,078, QUALITY 32 and MAX DD
What the Rule Held During the Worst Fall
The Max Drawdown for the whole window hides the question that matters here: what did the rule do between the peak on 2021-11-06 and the low on 2022-12-29? Our arithmetic on the trade log (UTC) answers it:
| Peak to low, 2021-11-06 to 2022-12-29 | Aroon rule |
|---|---|
| Trades open at any point in the span | 18 (6 wins) |
| Net result of those trades, after fees | -$5,496.70 |
| Trades opened and closed inside the span | 17 (5 wins), -$7,774.91 after fees |
| Days in the market | 148 of 418 (35.41%) |
The method is simple. For days in the market, we counted the days from each entry to each exit that fell inside the span, added them up and divided by the 418 days from peak to low. One of the 18 trades opened on 2021-10-20 before the peak and closed on 2021-11-17, which is why the two trade counts differ.
So the rule did step aside: it was out of the market for most of the fall. The damage came from the rallies. Each bounce turned Aroon Up above Aroon Down and the rule bought; the next leg down took it out at a loss. From December 2021 to March 2022 the log shows four losing trades in a row.
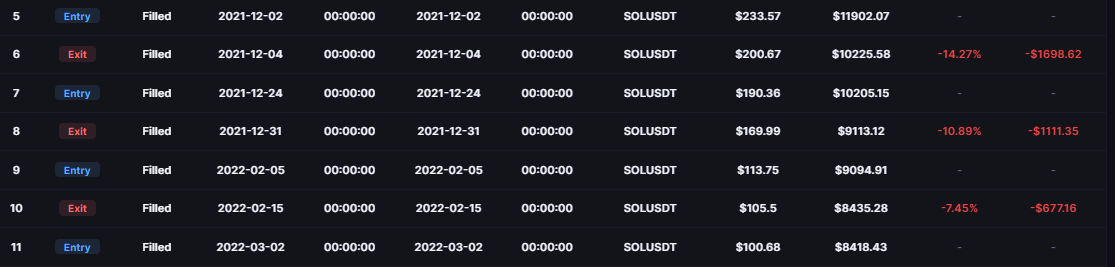
Order rows from December 2021 to March 2022, inside the worst SOL fall: Entry and Exit rows, all Filled, from a log of 128 orders (UTC)
Being out of the market on 270 of the 418 days kept most of the slide off the account. The cost was that every short rally drew the rule back in after a new 14-day high, and a falling market supplied plenty of short rallies.
What the Rule Gave Up
Stepping aside has a price, and over five years it was most of the return. The rule ended at $10,077.61; holding Solana ended at $21,002.12.
- Time in the market: 47.67% of the window for the rule, against 100% for holding.
- Late entries, early exits: Aroon only crosses after a new 14-day high or low, so the rule tends to buy after a rise has started and sell after a fall has started.
- Wins and losses: the average win was $2,421.57 and the average loss $1,550.30. The best single trade made $14,378.00, yet the total still ended near flat.
- Fees: $1,897.93 across 128 order rows, against $31.01 for the single hold.
After the low on 2022-12-29, holding rode the whole recovery back to the peak by 2025-01-18. The rule took part of that rise between exits. A shallower drawdown is worth something, but here it cost far more than it saved. For why the drawdown figure still matters, see how to read Maximum Drawdown.
What This Test Cannot Tell You
This is one test, and it answers a narrow question:
- One coin, one rule, one window: Solana, Aroon (14) and daily bars from 2021-08-01 to 2026-08-01.
- Fixed settings: another period or an added filter could behave differently.
- Costs: fees are included on entry and exit; no slippage is modelled.
- Long only: one position at a time, no leverage, no shorting the fall.
- Sample size: 64 trades over five years, and only 18 during the fall itself, so a handful of trades decide the result.
- Past data: nothing here forecasts how Solana moves after 1 August 2026.
Other Solana rules we tested reached different answers: buying overbought with the Stochastic on Solana and the Vertical Horizontal Filter on Solana.
The Practical Lesson
- Measure the fall, not only the window: the trade log shows what a rule did between the peak and the low.
- Stepping aside is not the same as protecting capital: this rule was out of the market for most of the fall and still lost $5,496.70 in it.
- Compare with holding: 0.78% against 110.02% is the real cost of the shallower drawdown.
In CoinQuant you can rerun the same rule on another coin or window and read the trade log the same way.
Build trading strategies on real data. No coding required.
Frequently Asked Questions
How far did Solana fall from its high?
Held from 2021-08-01, Solana fell 96.27% from its highest close on 2021-11-06 to its lowest close on 2022-12-29, and the holding was back at its peak on 2025-01-18.
Can a trend strategy avoid crypto crashes?
Partly. The Aroon rule in this test was in the market for 35.41% of Solana's worst fall and cut its Max Drawdown to 76.72%, but it still lost $5,496.70 in that span and returned 0.78% over five years against 110.02% for holding.
What is the Aroon indicator?
Aroon scores how few days have passed since a coin made its highest high (Aroon Up) and its lowest low (Aroon Down) within a set period, here 14 days. A cross of Aroon Up above Aroon Down is read as the start of an uptrend.
Test the same rule on another coin or window and see how it holds up.
Disclaimer:
Key Takeaway