
Buying Overbought: A Stochastic Momentum Strategy on Solana When %K Is Above 80 (2021-2026)
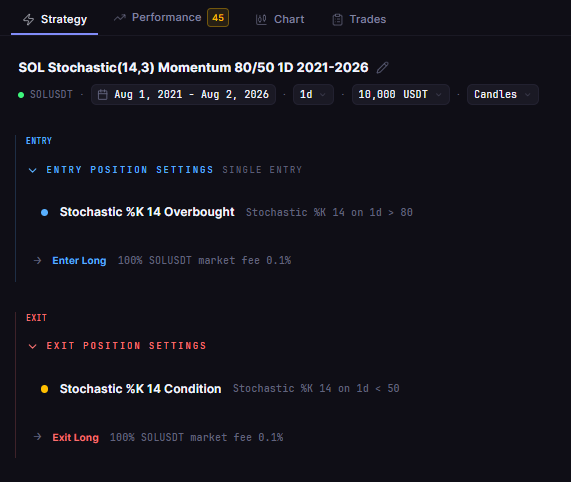
Most traders sell when the Stochastic oscillator goes above 80. This stochastic overbought momentum strategy does the opposite: the pictured rule buys Solana when %K is above 80 and sells when it is below 50. The captured backtest on daily SOLUSDT from August 2021 to August 2026 shows a reported return of 1,524.25% after fees over 54 trades, against 110.02% for SOL buy and hold.
The captured backtest shows how concentrated the result was. The very first trade returned 343.39% after fees, a handful of trades from late 2023 to early 2024 carried most of the rest and 10 of the 13 trades entered from August 2025 onward lost money. The Win Rate was only 42.59%.
This article describes the pictured rule in CoinQuant and reviews a captured backtest covering five years of daily SOL data with a 0.1% fee on every fill, showing where the reported gains came from.
The Rule: Buy When %K Is Above 80
The Stochastic oscillator shows where the close sits inside its recent high to low range, on a 0 to 100 scale. CoinQuant's indicator documentation gives the classic reading, overbought above 80 and oversold below 20, and calls the tool especially useful in ranging markets. This rule reads a push above 80 as strength instead.
- Entry: Stochastic %K (period 14) is above 80 on the daily chart
- Exit: Stochastic %K (period 14) is below 50
- Nothing else: no stop loss, no take profit and no trend filter
CoinQuant's Stochastic has a %K period and a %D period but no %K smoothing setting, so the rule uses the fast %K line. The indicator's %D period of 3 does not affect this rule, which never references %D.
In CoinQuant, an AI trading platform, you type the rule in plain English and the platform turns it into an entry condition and an exit condition and backtests it on historical data, with no coding required. A prompt in this form describes the same stochastic momentum entry:
Buy SOLUSDT on the daily chart when Stochastic %K (period 14) is above 80. Sell when %K is below 50. Test from August 2021 to August 2026 with $10,000, 100% of equity per trade and a 0.1% fee.
Test Setup
The captured strategy image is labelled SOL Stochastic(14,3) Momentum 80/50 1D 2021-2026. The table summarizes the pictured conditions and reported test context.
| Parameter | Setting |
|---|---|
| Strategy | SOL Stochastic(14,3) Momentum 80/50 1D 2021-2026 |
| Instrument | SOLUSDT (spot, Binance) |
| Data source | Kaiko via CoinQuant |
| Timeframe | Daily (1D) |
| Tested window | August 2021 to August 2026 |
| First trade to last exit | 2021-08-04 to 2026-07-11 (no position open at the end of the test) |
| Stochastic settings | %K period 14, %D period 3 (rule uses %K) |
| Entry | Stochastics(period=14, period_d=3, output=value_k) %K is above 80 |
| Exit | Stochastics(period=14, period_d=3, output=value_k) %K is below 50 |
| Direction | Long only, one position at a time, no leverage |
| Initial capital | $10,000 |
| Position size | 100% of equity per entry |
| Fees | 0.1% taker on entry and 0.1% on exit, modelled on every fill (no slippage set) |
| Baselines (same window) | SOL Buy and Hold 1D 2021-2026; BTC Buy and Hold 1D 2021-2026 |
In the captured Strategy tab, the rule reads as two plain conditions on daily SOLUSDT: %K is above 80 for entry and below 50 for exit.
Stochastic Overbought Momentum Strategy: Captured Backtest Results vs SOL Buy and Hold
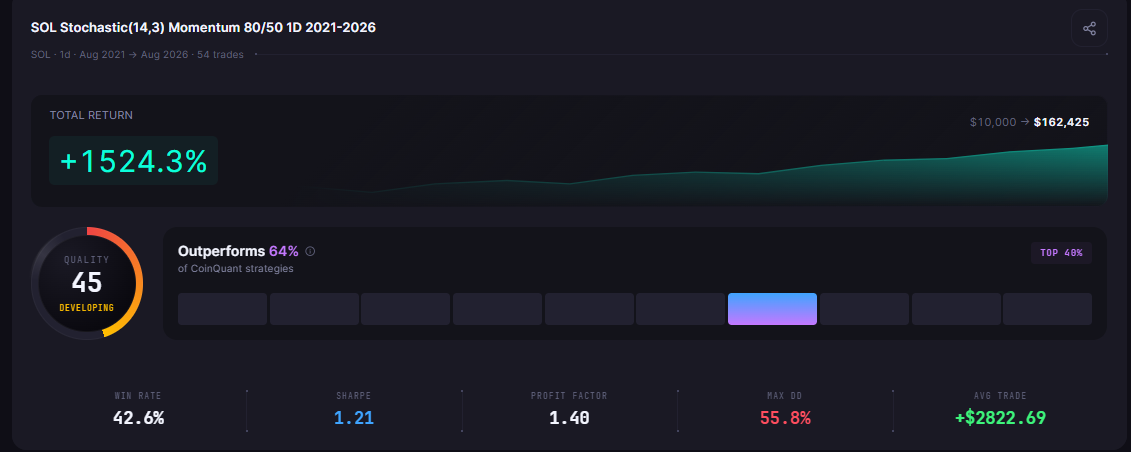
The captured backtest shows $10,000 growing to $162,425.32, a Total Return of 1,524.25%. Holding SOL turned the same $10,000 into $21,002.12 (+110.02%), and holding Bitcoin finished at $15,733.43 (+57.33%).
| Metric | Captured Stochastic 80/50 backtest | SOL buy and hold | BTC Spot Comparison |
|---|---|---|---|
| Backtest label | SOL Stochastic(14,3) Momentum 80/50 1D 2021-2026 | SOL Buy and Hold 1D 2021-2026 | BTC Buy and Hold 1D 2021-2026 |
| Total Return | +1,524.25% | +110.02% | +57.33% |
| Final Balance | $162,425.32 | $21,002.12 | $15,733.43 |
| Total Trades | 54 | 1 | 1 |
| Win Rate | 42.59% (23W / 31L) | n/a (single hold) | n/a (single hold) |
| Profit Factor | 1.40 | n/a | n/a |
| Sharpe Ratio | 1.21 | 0.64 | 0.44 |
| Max Drawdown | 55.80% | 96.27% | 76.63% |
| CAGR | +74.58% | +15.99% | +9.48% |
| Time in Market | 36.45% | 100.00% | 100.00% |
| Total Fees | $16,344.22 | $31.01 | $25.74 |
The comparison uses the reported runs for the same window, capital, sizing and 0.1% fee. Win Rate and Profit Factor are not shown for buy and hold because each baseline is a single trade.
The captured backtest lost more often than it won, yet its average winning trade made 36.26% after fees against an average loss of 8.10%. That gap is what a Profit Factor of 1.40 reflects. Its Max Drawdown of 55.80% was deep, but shallower than the 96.27% SOL buy and hold sat through.
With 54 trades the run clears the 50 trade bar, so the results card on the Performance tab rates it with a Quality score of 45. The platform's Buy and Hold benchmark carries no fees and ends at 110.44%, so the table uses the SOL Buy and Hold 1D 2021-2026 strategy (110.02%), which pays the 0.1% fee on entry and exit.
What the Trades Show
The captured backtest was in the market 36.45% of the time. The median trade lost 3.42% after fees: most signals failed quickly, and a few large winners paid for them. The table lists the six best trades by return after fees.
| Trade | Entry | Exit | Return after fees | Net P&L after fees |
|---|---|---|---|---|
| 1 | 2021-08-04 | 2021-09-14 | +343.39% | +$34,304.48 |
| 14 | 2023-01-03 | 2023-02-04 | +81.77% | +$23,518.36 |
| 19 | 2023-06-23 | 2023-07-20 | +47.91% | +$20,229.85 |
| 23 | 2023-10-19 | 2023-11-21 | +106.91% | +$60,594.54 |
| 24 | 2023-12-02 | 2024-01-03 | +54.50% | +$63,885.47 |
| 26 | 2024-02-28 | 2024-03-23 | +44.80% | +$83,611.58 |
Dollar figures grow over time because each entry used 100% of a larger account.
The first trade did a lot of the work
The first entry, on 2021-08-04, closed on 2021-09-14 for +343.39% after fees and took the account from $10,000 to $44,304.48. That one trade is 22.51% of the captured backtest's dollar profit. The other 53 trades compounded +266.61% on their own, still well ahead of SOL buy and hold.
Late 2023 to early 2024 carried the rest
The seven trades entered between September 2023 and April 2024 netted $184,856.52 after fees, more than the captured backtest's entire net profit of $152,425.32. Because the account was far larger by then, dollar totals give this stretch more weight than its percentage returns alone would.
The recent run went the other way
From August 2025 onward the captured backtest recorded 13 entries and 10 of them lost.
Why Overbought Is Not Always a Sell Signal
A reading above 80 says the close is near the top of its recent range. In a range, that often comes before a pullback, which is why the classic rule sells there. In a strong trend, price can keep closing near its highs, so a push above 80 can mark strength rather than exhaustion.
That is the idea behind buying when Stochastic is above 80, and it is the reverse of earlier CoinQuant tests. Stochastic Oscillator Strategy Backtested: Best for Range-Bound Crypto? and the slow Stochastic out of sample test on Bitcoin buy oversold readings, while the 12 month Stochastic backtest on Bitcoin compares settings using %K and %D crosses.
The captured SOL backtest shows gains in 2021 and late 2023 and mostly losses from August 2025. That pattern is consistent with the momentum idea, not proof of a reliable buy signal, and the pictured rule has no filter for the market regime.
What This Test Cannot Tell You
- Concentration: one trade and one stretch from September 2023 to April 2024 carry most of the profit. Remove them and the picture changes sharply.
- Indicator history: the first entry, on 2021-08-04, used Stochastic values built from SOL bars before the window, which the engine loads to start the indicator. That trade carries a large share of the result.
- One coin, one window, one setting: daily SOLUSDT from August 2021 to August 2026 with %K period 14. Other coins or settings may differ.
- Costs: the 0.1% fee on entry and exit is included ($16,344.22 in total), but no slippage was set, so real fills could be worse.
- No forecast: 54 trades is the whole sample, and it says nothing about SOL after August 2026.
The Practical Lesson
- The captured backtest shows a higher return than holding SOL: 1,524.25% against 110.02%, with a Max Drawdown of 55.80% against 96.27%.
- The gains were concentrated: the first trade alone took $10,000 to $44,304.48, and late 2023 to early 2024 did most of the rest.
- Recent trades mostly lost: 10 of the 13 entries from August 2025 onward lost money after fees.
Treat this as a reason to test whether overbought can signal strength, not as proof of a finished Solana stochastic strategy. In CoinQuant you can add a trend filter or test another coin or timeframe (it supports multi-indicator and multi-timeframe conditions).
Build trading strategies on real data. No coding required.
Frequently Asked Questions
Is buying when Stochastic is above 80 a good strategy?
The captured backtest on daily SOL from August 2021 to August 2026 shows a reported return of 1,524.25% after fees against 110.02% for buy and hold. But a few trades carried most of that, so it is a lead to test further, not a proven edge.
Does overbought mean sell in crypto?
Not by itself. A reading above 80 means price is closing near its recent highs, which can mark strength in a trend. Whether it is a sell or a buy depends on the market regime, so test both readings before you trust either.
What is the difference between fast and slow Stochastic?
Fast Stochastic uses the raw %K line. Slow Stochastic smooths %K with a short moving average, which is close to what CoinQuant's %D line is: a three period average of %K. The pictured rule uses the fast %K line.
Put your strategy to the test. Build and backtest it with CoinQuant. Backtest your strategy
Disclaimer:
Key Takeaway