
Eleven Losing Trades in a Row: Inside a Cardano Rule's Worst Streak
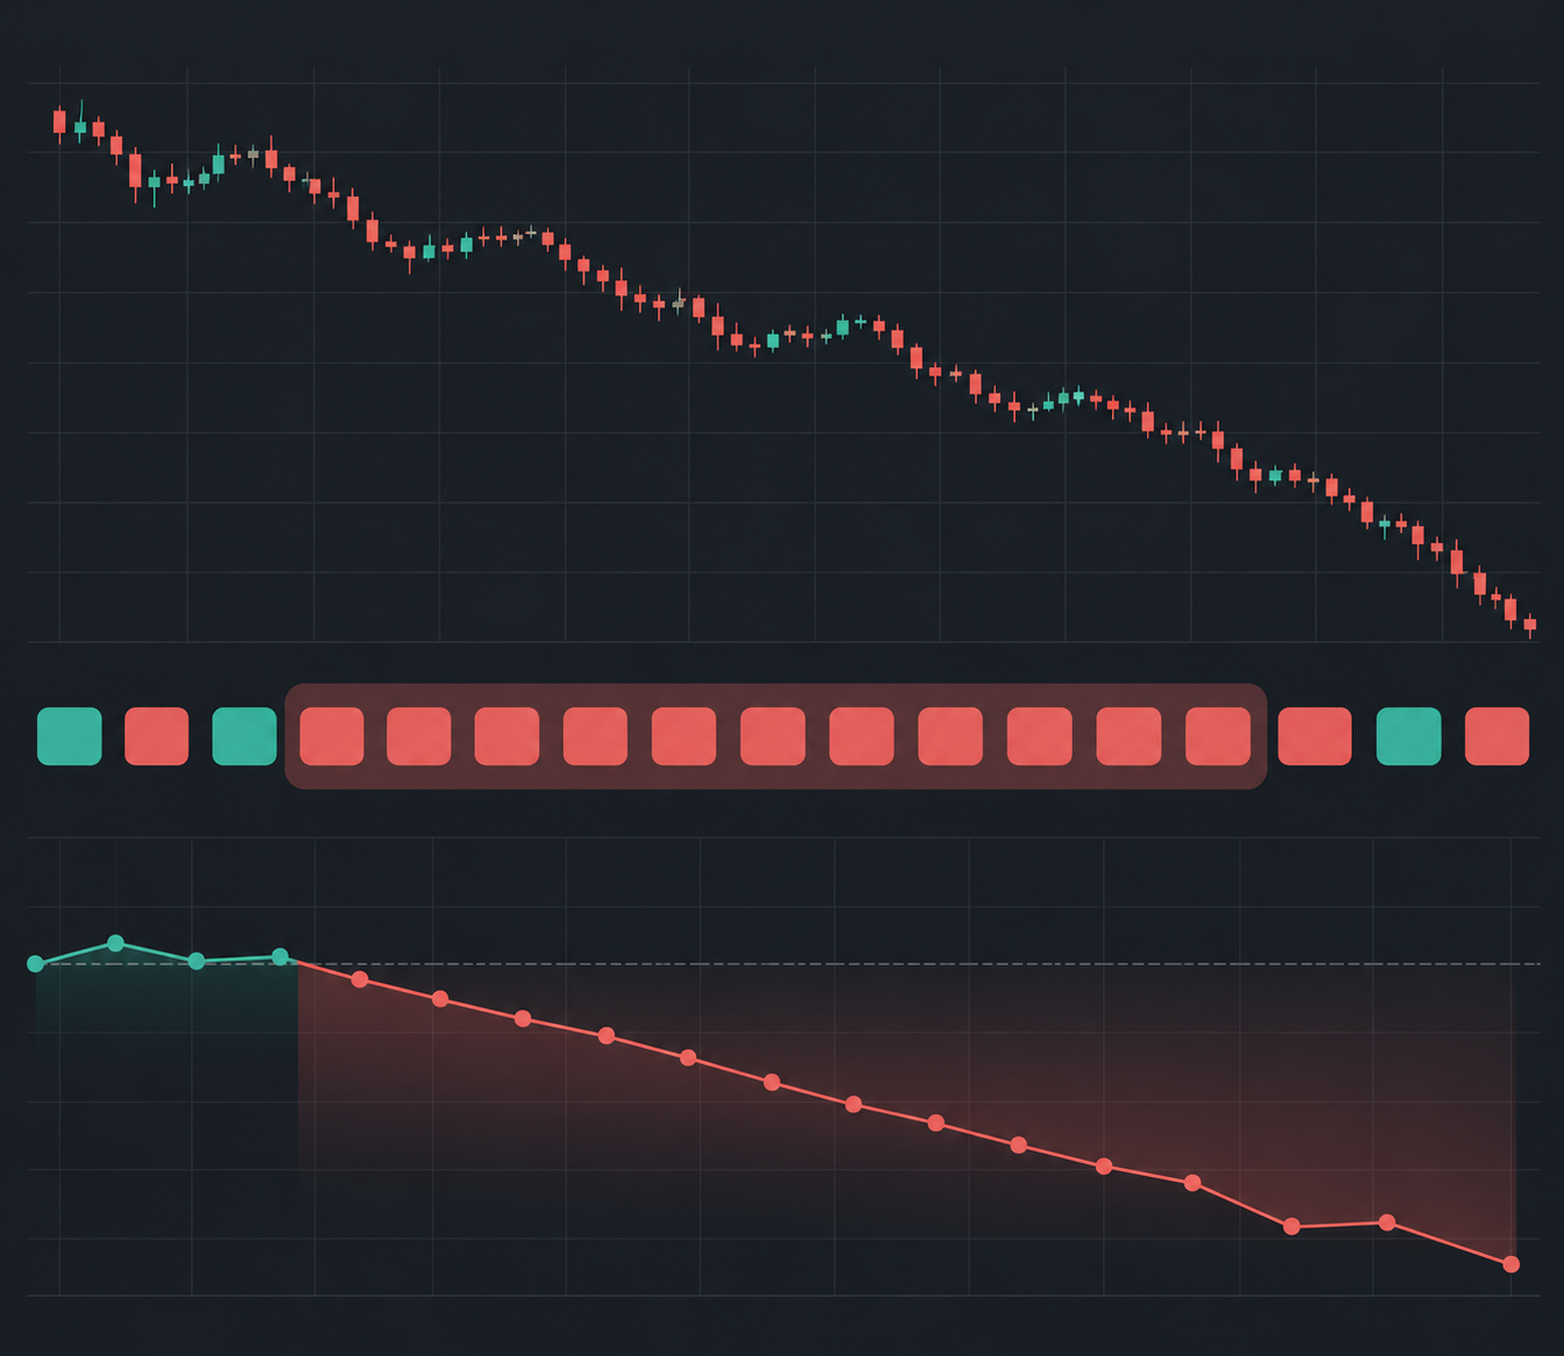
In CoinQuant's backtest of a Cardano rule that buys fresh swing lows, the worst stretch was 11 losing trades in a row, from 21 Oct 2025 to 29 Jan 2026, which took the account from $8,618.11 to $4,212.33. Long losing runs can hit any rule, so plan for them before they start.
Most advice on losing streak trading is about mindset. This article shows one real streak instead, trade by trade, from the trade log of a five-year backtest.
The rule itself lost money over the five years: -65.85%, against -86.76% for simply holding Cardano on the same window. It lost less than holding, but it still lost. The streak is part of why.
The Answer First: What an 11-Trade Losing Streak Looked Like
A CoinQuant backtest shows the streak plainly. Eleven trades in a row closed below their entry, between 21 Oct 2025 and 29 Jan 2026. Over those three months the account fell from $8,618.11 to $4,212.33, a fall of 51.12%, and the eleven trades lost $4,405.78 between them.
No single trade did the damage. The biggest percentage loss was 13.09%, on trade 110, and seven of the eleven lost between 3% and 7%. It was the run of them, one after another, that halved the account.
The timing matters. The streak began 15 days after Bitcoin's highest daily close, on 6 Oct 2025 (Binance BTCUSDT, UTC), and ran through the fall that followed. Cardano fell with it, and a rule that buys fresh swing lows kept buying lows that did not hold.
The Rule and the Setup
The rule uses CoinQuant's Swings indicator, which marks swing highs and swing lows in price. It buys Cardano when a new swing low is confirmed and the swing direction turns up, and it sells when a new swing high is confirmed.
| Parameter | Setting |
|---|---|
| Strategy | ADA Swing Points Fresh Swing Low Entry 1D 2021-2026 |
| Instrument | ADAUSDT (spot, Binance) |
| Data source | Kaiko via CoinQuant |
| Timeframe | Daily (1D) |
| Tested window | 2021-08-01 to 2026-08-01 |
| Entry | Swings (period 5, direction) crosses above 0: a new swing low is confirmed |
| Exit | Swings direction equals -1: a new swing high is confirmed |
| Direction | Long only, no leverage, one position at a time |
| Initial capital | $10,000 |
| Position size | 100% of equity per entry |
| Fees | 0.1% taker, modelled on every fill (no slippage set) |
| Baselines (same window) | ADA Buy and Hold 1D 2021-2026 |
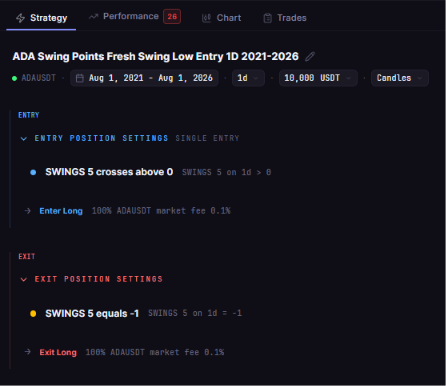
The stored rule of ADA Swing Points Fresh Swing Low Entry 1D 2021-2026: enter long when the Swings (period 5) direction crosses above 0, a confirmed swing low, and exit when the direction equals -1, a confirmed swing high.
Every fill in this backtest is at a daily close. The trade log stamps each fill with the candle's open time, so a row stamped 21 Oct 00:00 was filled at the close of 21 Oct UTC.
The Streak, Trade by Trade: Losing Streak Trading in a Real Log
These are trades 105 to 115 of the 127 the rule made, order rows 209 to 230 in the Trades tab. Each loss is after fees.
| Trade | Entry filled | Exit filled | PNL % | Net PnL |
|---|---|---|---|---|
| 105 | 21 Oct 2025 | 22 Oct 2025 | -3.15% | -$271.45 |
| 106 | 26 Oct 2025 | 28 Oct 2025 | -5.38% | -$448.34 |
| 107 | 8 Nov 2025 | 12 Nov 2025 | -4.24% | -$334.52 |
| 108 | 26 Nov 2025 | 1 Dec 2025 | -11.67% | -$881.58 |
| 109 | 2 Dec 2025 | 7 Dec 2025 | -3.93% | -$262.57 |
| 110 | 9 Dec 2025 | 12 Dec 2025 | -13.09% | -$839.43 |
| 111 | 22 Dec 2025 | 24 Dec 2025 | -4.10% | -$228.75 |
| 112 | 28 Dec 2025 | 31 Dec 2025 | -9.76% | -$521.89 |
| 113 | 2 Jan 2026 | 8 Jan 2026 | -0.02% | -$1.11 |
| 114 | 13 Jan 2026 | 16 Jan 2026 | -6.43% | -$310.11 |
| 115 | 28 Jan 2026 | 29 Jan 2026 | -6.78% | -$306.04 |
Two things stand out. Every trade lasted between one and six days: the rule kept buying fresh swing lows that did not hold. And trade 113 shows what fees do to a small trade: the price rose 0.18% between the entry and the exit, but after the 0.1% fee on each side the trade still lost $1.11.
This is the pattern of a rule caught in a falling, choppy market. Whipsaw trading explains how to measure false signals like these.
How Often Streaks Like This Happened
The run of eleven was the longest, but not the only one. Over five years the rule had six runs of five or more losing trades in a row.
| Run | Losing trades in a row | First entry | Last exit |
|---|---|---|---|
| 1 | 7 | 26 Apr 2023 | 5 Jul 2023 |
| 2 | 5 | 20 Jul 2023 | 22 Sep 2023 |
| 3 | 5 | 14 Mar 2024 | 7 May 2024 |
| 4 | 7 | 12 Jan 2025 | 16 Apr 2025 |
| 5 | 5 | 3 May 2025 | 1 Jul 2025 |
| 6 | 11 | 21 Oct 2025 | 29 Jan 2026 |
That frequency fits the rule's full record: a Win Rate of 29.92% over 127 trades, so seven trades in ten lost. With odds like that, long runs of losers are not bad luck. They are what the numbers predict.
Think of it this way. If most trades lose, a run of five losers needs nothing unusual, just five ordinary trades in a row. The runs also came in clusters: two in 2023, one in 2024 and three that began in 2025, the last of them running into January 2026. A rule like this pays for its few long winners with runs like these.
- Total Return: -65.85%
- Max Drawdown: 84.11%
- Profit Factor: 0.83
- Final balance: $3,414.74
- Total Fees: $1,709.95
- Time in Market: 44.24%
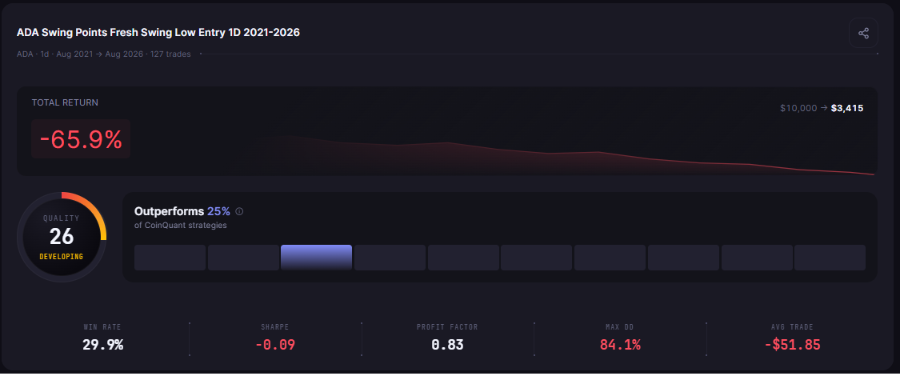
ADA Swing Points Fresh Swing Low Entry 1D 2021-2026, tested from August 2021 to August 2026: 127 trades, -65.9%, $10,000 to $3,415 and QUALITY 26 next to "Outperforms 25% of CoinQuant strategies".
The number of trades matters here too. How many trades a backtest needs explains why 127 trades is enough to take a pattern like this seriously.
Buy and Hold Comparison: Same Coin, Same Window
| Metric | ADA Swing Points rule | ADA buy and hold | BTC Spot Comparison |
|---|---|---|---|
| Strategy | ADA Swing Points Fresh Swing Low Entry 1D 2021-2026 | ADA Buy and Hold 1D 2021-2026 | BTC Buy and Hold 1D 2021-2026 |
| Total Return | -65.85% | -86.76% | 57.33% |
| Final Balance | $3,414.74 | $1,324.39 | $15,733.43 |
| Total Trades | 127 | 1 | 1 |
| Win Rate | 29.92% (38W / 89L) | n/a (single hold) | n/a (single hold) |
| Profit Factor | 0.83 | n/a | n/a |
| Sharpe Ratio | -0.09 | -0.02 | 0.44 |
| Max Drawdown | 84.11% | 95.15% | 76.63% |
| Time in Market | 44.24% | 100.00% | 100.00% |
All three runs share the same window, capital, sizing and fee. Holding Cardano lost more, so the rule ended ahead of holding, but both ended well below the $10,000 start, while holding Bitcoin over the same five years made 57.33%. A rule that beats a falling coin can still lose most of the money, which is why the benchmark a crypto strategy should beat matters.
The Performance tab's equity card shows both lines over five years. Its Buy and Hold line is the platform's line, which carries no fees; the table uses ADA Buy and Hold 1D 2021-2026, which pays the 0.1% fee on entry and exit.
What This Test Cannot Tell You
- Costs: fees included (0.1% taker fee on entry and exit), no slippage modelled.
- Setup: long only, one position at a time, no leverage.
- One coin, one window: Cardano fell for most of these five years. An adaptive trend rule on Cardano faced the same decline.
- The streak in equity terms: the $8,618.11 and $4,212.33 figures add up Net PnL trade by trade from the $10,000 start, the same way the final balance is built.
- No forecast: past results do not predict future results.
The Practical Lesson
- Read the Trades tab for runs, not just the total: this rule's longest run was eleven losers and it had six runs of five or more.
- Size for the worst run: eleven losses in a row took 51.12% of the account. Size positions so a run like that would not stop you.
- Watch fees on small trades: a 0.18% price rise still ended as a loss after fees.
On CoinQuant, an AI trading platform, the Trades tab lists every entry and exit with its PNL % and Net PnL, so you can find your own longest streak in a few minutes.
Build trading strategies on real data. No coding required.
Frequently Asked Questions
How long can a losing streak last?
Longer than most traders expect. This Cardano rule, with a Win Rate of 29.92%, had eleven losing trades in a row from 21 Oct 2025 to 29 Jan 2026, and five other runs of five or more. The lower the Win Rate, the longer the runs you should plan for.
Should I stop a strategy after a losing streak?
Not because of the streak alone. Decide in advance, from the backtest, what streak is normal for the rule. Here, runs of five or more happened six times in five years. A streak much longer than the backtest's worst is a better reason to stop and review.
How do fees affect small trades?
They can turn a small gain into a loss. With a 0.1% fee on entry and again on exit, a trade needs a price move of more than about 0.2% just to break even. Trade 113 here rose 0.18% on price and still lost $1.11.
Find the longest losing run in your own backtest before you trade it.
Run this ADA Swing Points Fresh Swing Low Entry backtest on CoinQuant
Disclaimer:
Key Takeaway