
Bullish Engulfing Pattern Backtest on BNB: Does the Candlestick Signal Pay Off With a 10% Target and 5% Stop? (2021-2026)
This bullish engulfing strategy backtest gives a modest answer: on BNB daily candles from 2021 to 2026, buying every Bullish Engulfing with a 10% target and a 5% stop returned 6.92% after fees. Holding BNB over the same five years returned 72.58%. The pattern did not lose money, but it captured only a sliver of the move.
The trade-off cuts the other way on risk. The strategy's Max Drawdown was 19.20%, against 69.85% for holding BNB, because it sat in cash for most of the period. It also produced just 18 trades, which is too few to call the result an edge.
We built the rule from CoinQuant's own Candle Pattern component at its default sensitivity, fixed the exits before testing and backtested it on Kaiko data via CoinQuant. This article reports the results without adjustment. No tuned parameters, no cherry-picked dates.
What a Bullish Engulfing Candle Is
A Bullish Engulfing is a two-candle reversal pattern. First comes a smaller bearish (red) candle; then a larger bullish (green) candle whose body completely covers the first candle's body. Traders read it as buyers taking control after sellers had the upper hand.
CoinQuant's Supported Elements documentation adds two useful details:
- Adaptive detection: the Candle Pattern indicator "detects adaptive candlestick patterns that adjust to recent price behavior rather than rigid textbook rules".
- Sensitivity modes: Any (loose), Typical (default), Textbook (strict) and Advanced (custom). We used Typical, the default.
The same page lists the pattern's limits: it is "less reliable inside ranges, can fail in strong downtrends, and works best with confirmation and volume." Candlestick patterns act as leading signals, so they fire early and many of them fail; our guide to leading vs lagging indicators explains that trade-off.
The Exact Rules We Tested
The strategy is saved in the Strategy Library as BNB Bullish Engulfing + TP10 SL5 1D 2021-2026. The rules below are copied from the stored strategy.
| Parameter | Setting |
|---|---|
| Strategy | BNB Bullish Engulfing + TP10 SL5 1D 2021-2026 |
| Instrument | BNBUSDT (spot, Binance) |
| Data source | Kaiko via CoinQuant |
| Timeframe | Daily (1D) |
| Tested window | 2021-08-01 to 2026-08-01 |
| First trade to last exit | 2021-09-29 to 2026-06-18 |
| Candle Pattern settings | Bullish Engulfing, Typical sensitivity (default) |
| Entry | Enter long when the Candle Pattern indicator detects a Bullish Engulfing on the closed daily bar; market order |
| Exit | Take profit 10% from the entry price (limit order) or stop loss 5% from the entry price (stop-market order), whichever comes first; no signal exit |
| Direction | Long only, no leverage, one position at a time |
| Initial capital | $10,000 |
| Position size | 100% of equity per entry |
| Fees | 0.1% on entry and on exit, charged on every fill, including the take profit and stop loss exits (no slippage set) |
| Baselines (same window) | BNB Buy and Hold 1D 2021-2026; BTC Buy and Hold 1D 2021-2026 |
The exits are deliberately simple: a target twice the size of the stop, set before the test. In CoinQuant the whole strategy is three blocks, one entry and two exits, built without code.

BNB Bullish Engulfing + TP10 SL5 1D 2021-2026 in the CoinQuant builder: one Candle Pattern entry and two fixed exits, a 10% take profit and a 5% stop loss, on daily BNBUSDT.
Bullish Engulfing Strategy Backtest Results vs BNB Buy and Hold
Here is how the pattern compared with holding BNB and holding Bitcoin over the same five years.
| Metric | Bullish Engulfing | BNB buy and hold | BTC Spot Comparison |
|---|---|---|---|
| Strategy | BNB Bullish Engulfing + TP10 SL5 1D 2021-2026 | BNB Buy and Hold 1D 2021-2026 | BTC Buy and Hold 1D 2021-2026 |
| Total Return | 6.92% | 72.58% | 57.33% |
| Final Balance | $10,692.14 | $17,257.91 | $15,733.43 |
| Total Trades | 18 | 1 | 1 |
| Win Rate | 38.89% (7W / 11L) | n/a (single hold) | n/a (single hold) |
| Profit Factor | 1.11 | n/a | n/a |
| Sharpe Ratio | 0.17 | 0.48 | 0.44 |
| Max Drawdown | 19.20% | 69.85% | 76.63% |
| CAGR | 1.35% | 11.52% | 9.48% |
| Total Fees | $387.29 | $27.27 | $25.74 |
All three runs share the same window, capital, sizing and fee, so the rows compare like with like. The pattern strategy finished behind both holds on Total Return, CAGR and Sharpe Ratio but far ahead of both on Max Drawdown.
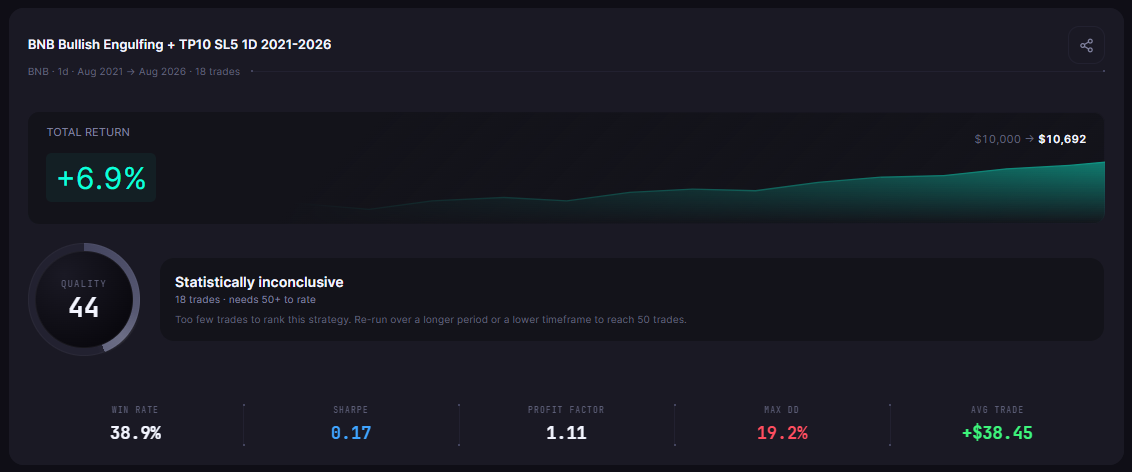
BNB Bullish Engulfing + TP10 SL5 1D 2021-2026, 2021-08-01 to 2026-08-01: 6.92% Total Return, 19.20% Max Drawdown, Profit Factor 1.11 and a 38.89% Win Rate over 18 trades, after a 0.1% fee per fill.
Fees matter at this scale. The strategy paid $387.29 in fees on 18 round trips, which is more than half of its $692.14 net profit.
Seven Targets, Eleven Stops: How the Exits Played Out
Every trade ended at a fixed exit. Seven hit the 10% take profit and eleven hit the 5% stop loss, so the Win Rate was 38.89%.
The fixed exits make the arithmetic unusually clean:
- Each winner: 9.79% after fees, the 10% target minus the cost of two fills.
- Each loser: about 5.2% after fees (between -5.19% and -5.20%), the 5% stop plus fees.
- Payoff Ratio: 1.74 in dollar terms, below the two-to-one ratio the rules aimed for, because fees shave the winners and deepen the losers.
That ratio is why a sub-40% Win Rate still produced a Profit Factor of 1.11: the winners paid for the losers with little to spare. The reward-to-risk setup only just paid.
The sequence was uneven. Nine of the 18 trades came in 2022, a falling market for BNB. Only three of those nine reached the target. The worst run was four stops in a row, and the last three trades of the test were all stopped out.
Profit is also concentrated. The best single trade, $1,117.68 from 2025-04-09 to 2025-05-09, is 161.48% of the strategy's whole net profit, so the other 17 trades lost money in total.
Lower Drawdown, Lower Return: The Time-in-Market Trade-off
The strategy was in the market 8.98% of the time. With about 3.60 trades a year and an average hold of about nine daily bars, it spent most of five years in cash.
That explains both halves of the result:
- Crash: it missed most of it. Max Drawdown was 19.20% against 69.85% for holding BNB.
- Rally: it missed most of that too. Total Return was 6.92% against 72.58%, and CAGR 1.35% against 11.52%.
A tighter or looser exit would change this balance, but each change is a new strategy with a new risk of fitting the past. The honest reading is that the 10% target caps every winner at 9.79% after fees, while holding BNB kept the whole move.
What This Test Cannot Tell You
This is one rule on one coin, so the limits are real:
- Small sample: 18 trades over five years cannot separate skill from luck.
- One asset: BNB only. The same rule may behave differently on other coins.
- One setting: Typical sensitivity and one target and stop pair. We did not test Textbook mode or other exits.
- No slippage: fees of 0.1% per fill are included; slippage was not modelled.
- No forecast: past results do not predict future returns.
If you want a broader starting point, our guide to crypto trading strategies covers every main strategy type, and the best crypto trading strategy for beginners shows a simpler rule with a backtest behind it.
The Practical Lesson
- A pattern is not a strategy: the Bullish Engulfing only became testable once the exits were fixed, and the exits decided most of the result.
- Check the fee drag: $387.29 in fees against $692.14 of net profit shows how thin a two-to-one setup gets after costs.
- Count the trades: 18 trades is a hypothesis, not proof.
- Pick your benchmark: against BNB buy and hold the rule lagged; against its own drawdown it looked calm.
The next useful test is the same entry with a confirmation, such as volume or a trend filter, as CoinQuant's own documentation suggests. In CoinQuant, an AI trading platform, that is one more condition in plain English, and multi-indicator conditions are supported.
Build trading strategies on real data. No coding required.
Frequently Asked Questions
Does the bullish engulfing pattern work in crypto?
On BNB daily candles from 2021 to 2026, with a 10% target and 5% stop, it made 6.92% after fees over 18 trades, far behind holding BNB at 72.58%. That is a small, thin result on one coin, not proof that the pattern works or fails in crypto generally.
What is the best take profit and stop loss for a bullish engulfing trade?
There is no single best pair, and searching for one invites overfitting. This test fixed a 10% target and 5% stop before running; after fees each win was 9.79% and each loss about 5.2%, which left a Profit Factor of 1.11.
Do candlestick patterns actually work for trading BNB?
In this backtest the Bullish Engulfing cut risk sharply, with a 19.20% Max Drawdown against 69.85% for holding, but it also gave up most of the upside. Test any pattern with fixed exits, fees and a large enough sample before trusting it.
Test the Bullish Engulfing on your own coin, exits and window.
Disclaimer:
Key Takeaway