
Leading vs Lagging Indicators: Which Should Your Crypto Strategy Use?
Every indicator family in trading belongs to one of two camps. Leading indicators try to anticipate price turns, and they fire early. Lagging indicators confirm moves after they start, and they fire late. The choice between them is not a style preference, it is a bet about which failure mode you can afford.
This guide compares the two families using verified backtests from the CoinQuant strategy library, where each indicator family is represented by a tested strategy on Bitcoin.
What Leading Indicators Do
Leading indicators are built from price and volume relationships that historically precede reversals. They are bounded oscillators, moving between defined extremes, and their signal is that price is stretched and due to turn.
The classic examples: RSI, Stochastic, and Money Flow Index. Their shared strength is timing, they get you in early, near turning points. Their shared weakness is that early is also wrong often, because a stretched oscillator can stay stretched.
What Lagging Indicators Do
Lagging indicators are built from averages of past price, and they follow the trend. Their signal is that a move has already started and is likely to continue.
The classic examples: simple and exponential moving averages, MACD, and Bollinger Bands. Their shared strength is reliability in trends, they only act on confirmed moves. Their shared weakness is the lag itself: by the time they confirm, part of the move is gone, and in ranges they whipsaw.
The Library Evidence
The CoinQuant library contains verified backtests of both families on Bitcoin, which turns the theoretical contrast into numbers.
| Family | Strategy (library name) | Backtest result |
|---|---|---|
| Leading | BTC RSI(14) Mean Reversion 1d | +55.76%, 13 trades, 5 years |
| Leading | BTC MoneyFlowIndex(14) Midpoint Cross 1D | -13.78%, 16 trades, 12 months |
| Lagging | BTC Trend Following 1D 2021-2026 | +82.80%, 25 trades, 5.6 years |
| Lagging | BTC EMA Crossover 20/50 1D 2021-2026 | +79.16%, 16 trades, 5.6 years |
| Lagging | BTC Bollinger Mean Reversion 1D 2021-2026 | +10.36%, 35 trades, 5.6 years |
| Leading | BTC Mean Reversion 1D 2021-2026 | +39.29%, 14 trades, 5.6 years |
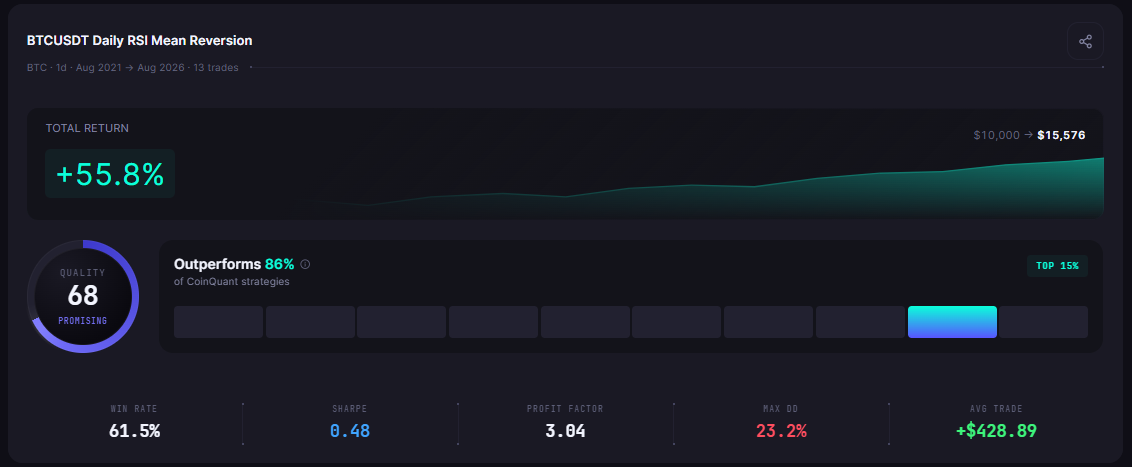
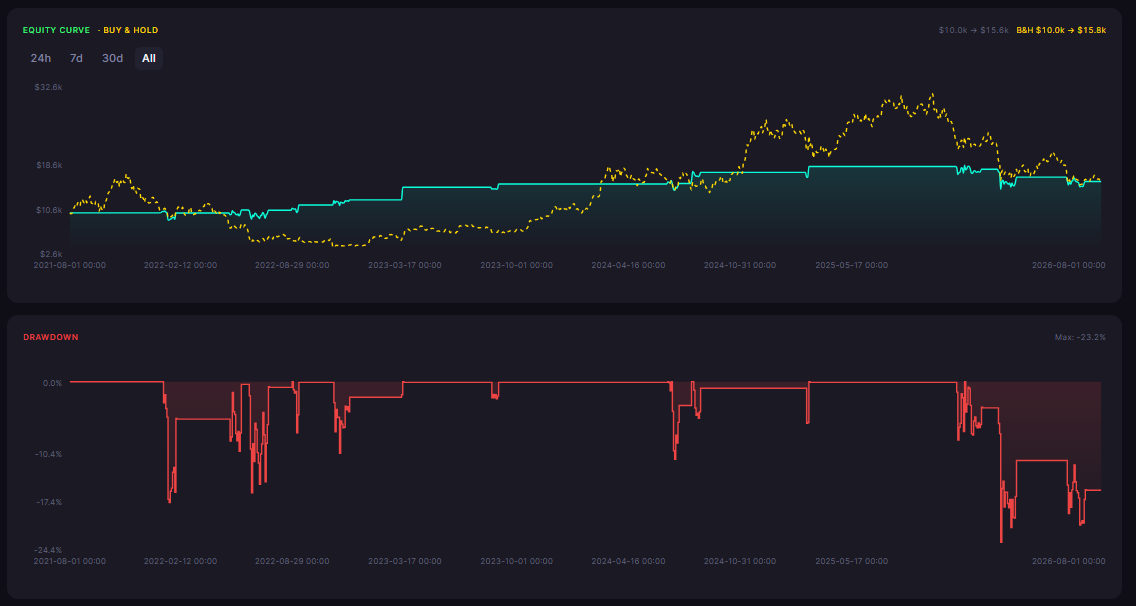
The sample is small and the windows are not identical, so the table is evidence, not a verdict. What it shows is the pattern theory predicts: the lagging trend family produced the largest returns over the full cycle, and the leading oscillator family produced the most divergent outcomes, from +55.76% to -13.78% depending on the exact rule.
The Tradeoff in One Table
| Dimension | Leading indicators | Lagging indicators |
|---|---|---|
| Signal timing | Early, near turning points | Late, after confirmation |
| Examples | RSI, Stochastic, MFI | SMA, EMA, MACD, Bollinger |
| Best environment | Ranging markets, reversals | Trending markets |
| Worst failure | Fires too early, catches falling knives | Enters too late, whipsaws in ranges |
| Typical win rate | Higher, smaller wins | Lower, larger wins |
| Library example | RSI(14) MR 1d: 61.5% win rate | Trend Following 1D: 20.0% win rate |
The win rate row is the practical tell. The leading RSI strategy won 61.5% of trades. The lagging trend follower won 20.0%. And the trend follower made more money, because its winners were 8.1 times its losers while the RSI strategy's wins were only 1.9 times its losses. Leading indicators feel better, lagging indicators often pay better.
Why the Regime Decides
The honest answer to "which should I use" is that the market regime decides, and the strategy must state its regime assumption.
In a range, leading indicators win. Oscillators catch the bounces, and trend followers get chopped
In a trend, lagging indicators win. Moving averages ride the move, and oscillators exit too early
In an unknown regime, the test decides. Run both families on the same window and compare, which is exactly what a backtest is for
The 2021-2026 window on Bitcoin was trend-dominated, which is why the lagging family leads the table. The same comparison run on a 12-month range, like the one the MFI midpoint strategy was tested in, flips the ranking, which is why the MFI rule lost while the trend rules profited.
The Psychological Difference
There is a behavioral difference between the families that the metrics do not capture, and it decides whether a strategy survives contact with a live account. Leading indicator strategies produce frequent small wins and occasional deep losses, which feels productive and trains the trader to trust the system. Lagging indicator strategies produce long strings of small losses punctuated by rare large wins, which feels broken even when the numbers are strong.
The library evidence makes the contrast concrete: the RSI mean reversion strategy won 61.5% of its trades, so a trader running it saw a winner more often than not. The trend follower won 20.0%, so a trader running it lost four out of every five trades and had to hold through that experience to reach the +82.80% result. Most traders abandon lagging strategies in the losing streak, which is precisely when the payoff is being built.
The practical conclusion: choose the family whose felt experience you can tolerate, not the one that looks best on paper, and let the backtest's drawdown and win rate tell you what the experience will actually be.
How to Combine Them
Most serious strategies use both families in defined roles instead of picking one:
A lagging filter for the big picture: only trade long when price is above the 200-day average
A leading trigger for timing: enter on the oscillator signal inside that trend filter
Separate backtests for each component, so the contribution of each family is measurable
The BTC OBV(20) Trend 1D strategy is a library example of the pattern: a lagging-style trend condition (close above the SMA 50) combined with a volume-flow confirmation, producing +57.27% over 5.6 years with a 22.2% win rate.
The Practical Lesson
Leading indicators time entries and cost you in whipsaws; lagging indicators confirm trends and cost you in entry price
The regime decides the winner. Trend-dominated windows favor lagging families, ranges favor leading families
Win rate is not the edge. The 20% win rate trend follower out-earned the 61.5% win rate oscillator rule
Test both families on your window before choosing, and state the regime assumption in the strategy
Backtest indicator families free on CoinQuant
Disclaimer:
Key Takeaway