
VIDYA Strategy Backtest on Ethereum: What 5 Years of Variable Index Dynamic Average Signals Show

A VIDYA indicator strategy promises a moving average that speeds up when the market trends and slows down when it chops. On daily Ethereum from August 2021 to August 2026, that promise did not translate into profit. The simple close-cross rule lost 27.43% across 75 trades, almost exactly what holding ETH lost over the same window (27.95%).
The one place it helped was pain. The strategy's worst peak-to-trough drop was 59.85%, against 79.30% for buy and hold, because it spent more than half the period in cash.
This article tests the documented default VIDYA setting on ETHUSDT with fees modelled, compares it with ETH and Bitcoin buy and hold on the identical window and reports the results without adjustment. No tuned parameters, no cherry-picked dates.
What a VIDYA Indicator Strategy Does
VIDYA stands for Variable Index Dynamic Average. It is an exponential-style moving average whose smoothing speed is scaled by a volatility input, so it hugs price when the market moves with conviction and flattens out when direction fades.
In CoinQuant, the volatility input is the Chande Momentum Oscillator (CMO). The CoinQuant Supported Elements documentation lists the defaults this test uses, and the CoinQuant changelog records VIDYA's addition alongside Swings and AROON in February 2026.
Period: 14 bars
Source: Close
Volatility input: CMO
The rules are as plain as a moving-average strategy gets:
Entry: the daily close crosses above VIDYA(14)
Exit: the daily close crosses below VIDYA(14)
Long only, one position at a time, no leverage, no stop loss and no extra filters. In CoinQuant you can describe it in plain English, for example: "Buy ETHUSDT on the daily chart when the close crosses above VIDYA with period 14, close source and CMO volatility input. Sell when the close crosses below it." No coding required.
Test Setup
| Parameter | Setting |
|---|---|
| Strategy | ETH VIDYA(14) Cross 1D 2021-2026 |
| Instrument | ETHUSDT (spot, Binance) |
| Data source | Kaiko via CoinQuant |
| Timeframe | Daily (1D) |
| Tested window | 2021-08-01 to 2026-08-01 |
| First trade to last exit | 2021-09-11 to 2026-08-01 (last position closed at the end of the test) |
| VIDYA settings | Period 14, source Close, CMO volatility input (the strategy schema stores the CMO moving-average type as Simple Moving Average) |
| Entry | Close crosses above VIDYA(14, Close, CMO) |
| Exit | Close crosses below VIDYA(14, Close, CMO) |
| Direction | Long only, no leverage |
| Initial capital | $10,000 |
| Position size | 100% of equity per entry |
| Fees | 0.1% taker, modelled on every fill (no slippage set) |
| Baselines (same window) | ETH Buy and Hold 1D 2021-2026; BTC Buy and Hold 1D 2021-2026 |
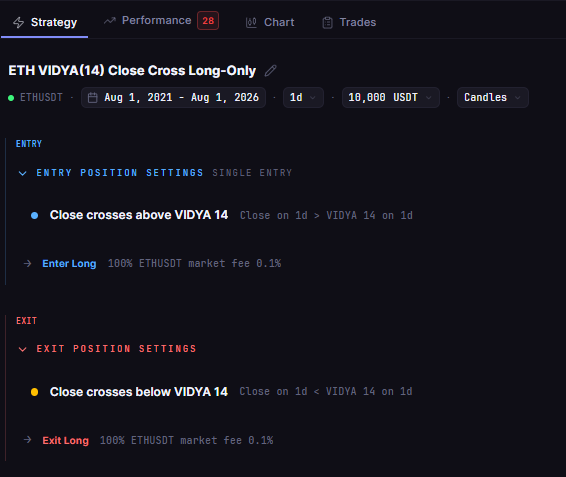
ETH VIDYA(14) Cross 1D 2021-2026 in the CoinQuant strategy builder: one entry cross and one exit cross on daily ETHUSDT, using the default VIDYA settings.
Screenshot from the author's CoinQuant account. Backtest results are hypothetical, based on historical data with modelled fees, and do not guarantee future performance. Not financial advice.
Results vs ETH Buy and Hold
The VIDYA cross turned $10,000 into $7,256.80, a -27.43% return from 75 trades. Holding ETH over the same five years finished at $7,205.03 (-27.95%), and holding Bitcoin finished at $15,733.43 (+57.33%).
| Metric | VIDYA cross | ETH buy and hold | BTC Spot Comparison |
|---|---|---|---|
| Strategy | ETH VIDYA(14) Cross 1D 2021-2026 | ETH Buy and Hold 1D 2021-2026 | BTC Buy and Hold 1D 2021-2026 |
| Total Return | -27.43% | -27.95% | +57.33% |
| Final Balance | $7,256.80 | $7,205.03 | $15,733.43 |
| Total Trades | 75 | 1 | 1 |
| Win Rate | 16.00% (12W / 63L) | n/a (single hold) | n/a (single hold) |
| Profit Factor | 0.86 | n/a | n/a |
| Sharpe Ratio | 0.05 | 0.26 | 0.44 |
| Max Drawdown | 59.85% | 79.30% | 76.63% |
| CAGR | -6.21% | -6.34% | +9.48% |
| Average Win / Average Loss | $1,406.86 / $311.52 | n/a | n/a |
| Best Trade / Worst Trade | +$3,685.69 / -$1,440.81 | n/a | n/a |
| Time in Market | 41.82% | 100% | 100% |
| Total Fees | $1,189.84 | $17.20 | $25.74 |
All three runs share the same window, capital, sizing and 0.1% taker fee, so the rows compare like with like. Win rate and profit factor are not shown for buy and hold because each benchmark is a single trade.
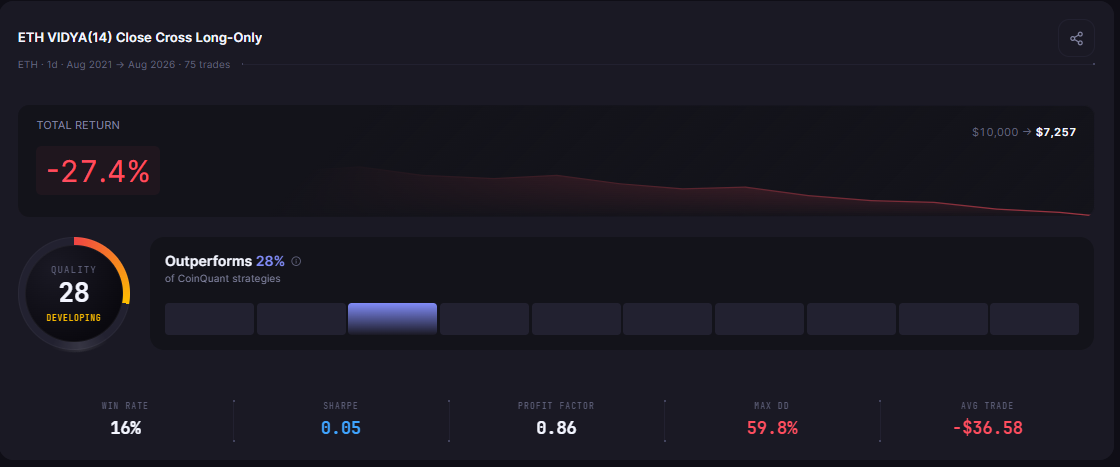
ETH VIDYA(14) Cross 1D 2021-2026 finished at -27.43% after 75 trades, with a 59.85% max drawdown.
Screenshot from the author's CoinQuant account. Backtest results are hypothetical, based on historical data with modelled fees, and do not guarantee future performance. Not financial advice.
What the Data Shows
12 winners in 75 trades, carried by a handful of trends
Only 12 of the 75 trades made money. The winners were large, with an average win of $1,406.86 against an average loss of $311.52, a payoff ratio of 4.52.
That was still not enough. A profit factor of 0.86 means the strategy earned 86 cents of gross profit for every dollar of gross loss. The best trade bought ETH at $2,304.28 on 2024-02-01 and sold at $3,523.10 on 2024-03-16 for +$3,685.69, and the strategy also sat through a streak of 13 consecutive losing trades.
Fees deepened the loss
The strategy paid $1,189.84 in fees across 150 fills. It finished $2,743.20 below its starting capital, so fees were a large share of the damage.
This is the core problem with a fast adaptive line on a daily chart. VIDYA reacts quickly when the CMO is strong, which means many short trades that each pay a round trip of fees. The worst trade entered at $4,348.03 on 2025-10-01 and exited nine days later at $3,829.72 for -$1,440.81.
Less time exposed, a shallower drawdown
The strategy held ETH only 41.82% of the time. That cut the maximum drawdown to 59.85%, 19.45 percentage points shallower than buy and hold's 79.30%.
The risk-adjusted numbers do not reward it, though. The Sharpe ratio of 0.05 sits well below ETH buy and hold (0.26) and BTC buy and hold (0.44), so the smaller drawdown came with a similar loss and a much weaker return per unit of volatility.
Where an Adaptive Average Helps and Where It Fails
The trade log, grouped by exit year, shows exactly where the rule earned and where it bled. Net P&L is summed from the backtest's trades file by exit date.
| Exit year | Trades | Net P&L after fees |
|---|---|---|
| 2021 (from Sep) | 6 | -$964.18 |
| 2022 | 15 | -$3,685.78 |
| 2023 | 16 | -$51.03 |
| 2024 | 17 | +$2,978.53 |
| 2025 | 12 | +$1,508.33 |
| 2026 (to Aug) | 9 | -$2,529.07 |
The pattern matches what the indicator is built to do. It captured the sustained ETH advances of early 2024 and mid-2025, and it lost money in the 2022 decline, the stop-start 2023 recovery and the 2026 sell-off.
| Where VIDYA helps | Where VIDYA fails |
|---|---|
| Sustained trends: a strong CMO speeds the line up, so entries come early in a real move | Choppy ranges: price crosses a fast line repeatedly, and each cross pays fees |
| Bear phases: the close-below exit takes the strategy to cash and caps the deepest drawdown | Sharp reversals: the line can flip late enough to exit near a low and re-enter near a high |
| Low time in market (41.82%), which limits exposure to crashes | Low win rate (16.00%), so results hinge on a few large trends showing up |
The adaptive speed is a double-edged feature. The same responsiveness that catches a trend early also reacts to noise, and on daily ETH over these five years the noise won.
The Practical Lesson
A default VIDYA indicator strategy on daily ETH returned -27.43% from August 2021 to August 2026, a hair better than holding ETH (-27.95%) and far behind holding Bitcoin (+57.33%)
Its real benefit was risk: a 59.85% maximum drawdown against 79.30% for ETH buy and hold, with only 41.82% time in market
Its real cost was trade count: 75 trades, a 16.00% win rate and $1,189.84 in fees left a profit factor of 0.86
The rule worked in clean trends (2024 and 2025) and failed in chop and declines (2022, 2023 and 2026)
The useful next step is not to abandon VIDYA but to test whether it needs a slower setting or a filter. In CoinQuant, an AI trading platform, you can try a longer VIDYA period, add a higher-timeframe trend condition (CoinQuant supports multi-timeframe and multi-indicator conditions) or compare the same rule on another asset. Each variation needs its own backtest before it earns a place in a live strategy.
Build trading strategies on real data. No coding required.
Test the VIDYA rule on your own asset and window. Run this VIDYA backtest free on CoinQuant
Disclaimer:
Key Takeaway
