
A 4H Trading Strategy on Ether, Tested: One Year of a Momentum Rule vs Holding ETH (2025-2026)

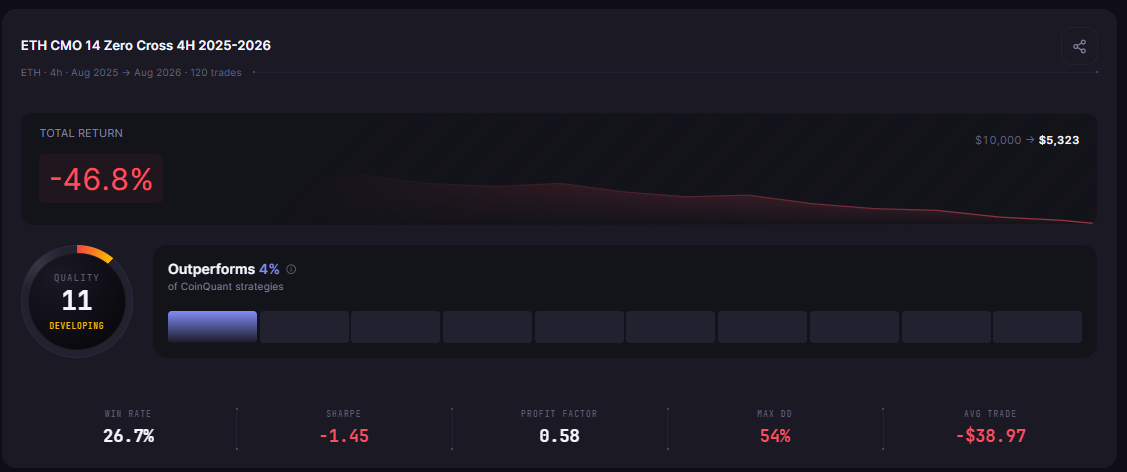
A 4h trading strategy on Ether lost less than holding ETH over the same dates, but it still lost money. On CoinQuant, an AI trading platform, the ETH CMO 14 Zero Cross 4H 2025-2026 rule turned $10,000 into $5,323.18 (-46.77%) over 120 trades on the ETH 4h chart. Holding ETH over the same dates ended at $4,010.99 (-59.89%).
The test runs from 12 August 2025 to 1 August 2026, a window of 354 days. The rule's Max Drawdown was 53.95% against 67.55% for holding, and trading every few days cost it $1,792.16 in fees. Fees are included in every figure; no slippage was modelled.
The author ran both backtests on CoinQuant with the same capital, sizing and fee. This article reports the results without adjustment: no tuned parameters and no dates picked after the fact.
Why a 4H Trading Strategy Is Different
A 4-hour chart prints six candles a day instead of one. Over this window that meant 2,270 bars of 4 hours for the rule, against 355 daily bars for the Buy and Hold run.
More bars mean more signals, more trades and more fees. That is the cost of any 4h swing trading strategy: earlier entries and exits, paid for with more round trips.
Swing traders read the ETH 4h chart to catch moves that last days, not months. This test asks one plain question: did a simple momentum rule on that chart beat holding once fees were counted? For the same oscillator on five years of daily Bitcoin candles, see the Chande Momentum Oscillator backtest on Bitcoin.
The Rule and the Settings
The Chande Momentum Oscillator (CMO) compares the up moves with the down moves over its lookback and sits between -100 and +100. Above 0, gains have outweighed losses over the lookback; below 0, losses have.
Here is the rule as stored on CoinQuant, in plain English:
Buy ETHUSDT on the 4-hour chart when the Chande Momentum Oscillator (period 14) crosses above 0. Sell when it crosses below 0. Test from August 12, 2025 to August 1, 2026 with $10,000, 100% of equity per trade and a 0.1% fee.
| Parameter | Setting |
|---|---|
| Strategy | ETH CMO 14 Zero Cross 4H 2025-2026 |
| Instrument | ETHUSDT (spot, Binance) |
| Data source | Kaiko via CoinQuant |
| Timeframe | 4 hours (4H) |
| Tested window | 2025-08-12 00:00 to 2026-08-01 20:00 UTC (354 days) |
| First trade to last exit | 2025-08-17 20:00 to 2026-07-30 20:00 UTC |
| CMO settings | Period 14, zero line |
| Entry | CMO(14) crosses above 0 on the 4h timeframe |
| Exit | CMO(14) crosses below 0 on the 4h timeframe |
| Direction | Long only, no leverage, one position at a time |
| Initial capital | $10,000 |
| Position size | 100% of equity per entry |
| Fees | 0.1% taker, modelled on every fill (no slippage set) |
| Baseline (same window) | ETH Buy and Hold 1D Aug 2025-Aug 2026 (daily bars, 2025-08-12 to 2026-08-01) |
Both runs start on 12 August 2025 with $10,000. Holding buys on that first daily bar; the rule waits in cash until its first signal, on 17 August 2025 at 20:00 UTC.
Result and Buy and Hold Comparison
| Metric | CMO 14 rule (4H) | ETH Buy and Hold (same window) |
|---|---|---|
| Strategy | ETH CMO 14 Zero Cross 4H 2025-2026 | ETH Buy and Hold 1D Aug 2025-Aug 2026 |
| Total Return | -46.77% | -59.89% |
| Final Balance | $5,323.18 | $4,010.99 |
| Total Trades | 120 | 1 |
| Win Rate | 26.67% (32W / 88L) | n/a (single hold) |
| Profit Factor | 0.58 | n/a (single hold) |
| Sharpe Ratio | -1.45 | -1.12 |
| Max Drawdown | 53.95% | 67.55% |
| Average Win / Average Loss | $205.17 / $127.75 | n/a (single hold) |
| Time in Market | 45.59% | 99.72% |
| Total Fees | $1,792.16 | $14.01 |
BTC Spot Comparison, Different Window: 1 Aug 2021 to 1 Aug 2026
| Strategy | Total Return | Max Drawdown | Sharpe Ratio | Final Balance | Total Fees | Total Trades |
|---|---|---|---|---|---|---|
| BTC Buy and Hold 1D 2021-2026 | 57.33% | 76.63% | 0.44 | $15,733.43 | $25.74 | 1 |
No Bitcoin run covers the ETH dates, so this BTC row comes from a different, longer five-year window. It is context only, not a like for like row.
What the Numbers Say
Both ETH runs share the start date, capital, sizing and fee. The rule trades 4-hour bars and the hold uses daily bars, so the hold's last bar is 1 August 2026 at 00:00 UTC and the rule's is 20:00 UTC that day.
The rule lost less than holding and fell less at its worst. On Sharpe Ratio, though, holding scored better: -1.12 against -1.45.
The rule won 32 of its 120 trades. Its Average Win ($205.17) beat its Average Loss ($127.75), but not by enough to cover 88 losses: a Profit Factor of 0.58 means 58 cents of gross profit for every dollar of gross loss.
Time in Market shows the other side. The rule held a position 45.59% of the time, while the hold sat in ETH for 99.72% of it. Spending more than half the window in cash limited the rule's exposure to a falling market, but its trades still lost money on balance.
On the Performance tab, the rule's results card shows 120 trades and a QUALITY of 11; the API places it ahead of 4% of CoinQuant strategies. The hold is a single trade, so its card marks it "Statistically inconclusive" (1 trade · needs 50+ to rate) next to a QUALITY of 7.
How Much of the Result Went to Fees
The rule lost $4,676.82 in total, and fees took $1,792.16 of that: 38.32% of the loss, against $14.01 in fees for holding. At 0.1% on each side, every round trip paid two fees, one on the way in and one on the way out, and the rule made 120 round trips.
The busiest week, 22 to 28 December 2025 (UTC), held eight entries. They sit in order rows 91 to 106 of the trade log, and five of those eight trades closed at a loss. Each order paid between $7.28 and $7.70 in fees, and the biggest loss of the week, on order row 94, was -$129.62.
A 4h chart trading strategy that trades this often needs each win to pay two fees as well as the losses. Here the average trade lost $38.97.
Why One Year Is a Short Test
The window is 354 days, on one coin, with one setting. ETH fell hard over those dates: the Buy and Hold run bought at $4,590.52 and sold at $1,844.94, the engine's fill prices. A rule tested only in a falling market says little about a rising one.
The rule's 120 trades clear the 50 trades the results card needs before it rates a run, but they all come from one stretch of market. For how many trades a test needs, see how many trades a backtest needs before you can trust it. For why the length of the window matters, see how much historical data a reliable crypto backtest needs.
What This Test Cannot Tell You
- Costs: fees included at 0.1% on entry and 0.1% on exit; no slippage modelled, so fills in fast 4-hour moves could be worse.
- Direction: long only, one position at a time, no leverage.
- Window: the backtest ends on 1 August 2026 and covers no later prices.
- Settings: one period (14) and one threshold (0); other settings give other results.
- Future: past results do not predict future results.
For other ways to trade Ether, compare five Ethereum trading strategy approaches, backtested.
The Practical Lesson
- A faster chart multiplies fees: 120 trades cost $1,792.16, or 38.32% of the loss.
- Losing less is still losing: -46.77% for the rule against -59.89% for holding.
- Judge the sample: 354 days of one falling market is a start, not a verdict.
Test any 4-hour signal with fees included, and compare it with holding over the same dates, before you trust it. CoinQuant supports multi-timeframe strategies, so the same rule can be rebuilt on daily candles or another coin.
Build trading strategies on real data. No coding required.
Frequently Asked Questions
What is a good 4h trading strategy?
One that beats holding the same coin over the same dates after fees, across enough trades to judge. The CMO 14 rule tested here beat holding over this window, but it still lost 46.77% over 120 trades, compared with holding's 59.89% loss.
Does trading the 4-hour chart cost more in fees?
Usually, because more candles produce more signals. This rule paid $1,792.16 in fees over 120 trades, while holding ETH over the same dates paid $14.01.
Is one year of data enough?
Not on its own. This test covers 354 days of mostly falling ETH prices, so treat it as one data point and test a longer window where the data allows.
Rebuild the rule on your own coin and timeframe, with fees included.
Disclaimer:
Key Takeaway