
Chande Momentum Oscillator Strategy Backtest on Bitcoin: What 5 Years of Data Shows
The Chande Momentum Oscillator has a reputation problem that is also its selling point: it swings harder than almost any other momentum indicator. Created by Tushar Chande to measure raw momentum without smoothing, the CMO reacts fast, moves between -100 and +100, and flips direction with every shift in buying pressure.
Traders frustrated by RSI's slow, smoothed signals often ask whether CMO's faster read produces cleaner entries on Bitcoin. This article answers that with data: a single mechanical CMO strategy, tested on daily BTC from August 2021 to August 2026, with fees modeled, against buy and hold on the same market.
The short version: the signal works, barely, and it trades constantly. The details matter more than the headline.
What the CMO Strategy Actually Does
The Chande Momentum Oscillator sums up moves and down moves over a lookback period, then expresses the difference as a percentage of total movement. Near +100, almost all movement is upward; near -100, almost all is downward. Zero is the midpoint where buying and selling pressure balance.
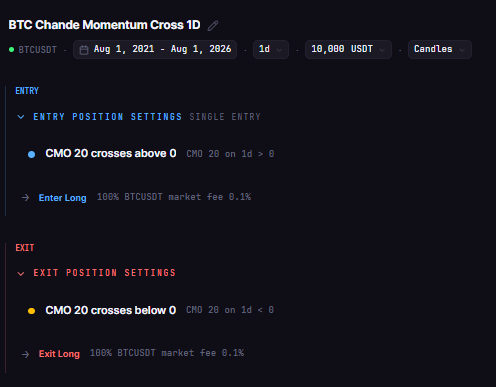
This test uses the classic mechanical reading of that scale, with the platform's default period of 20:
Entry: CMO(20) crosses above zero
Exit: CMO(20) crosses below zero
That is the simplest trend-expression of the indicator: hold Bitcoin while raw momentum is positive, step aside when it turns negative. It is long only, one position at a time, no leverage, and it makes no attempt to filter signals.
Test Setup
| Parameter | Setting |
|---|---|
| Strategy | BTC Chande Momentum Cross 1D 2021-2026 |
| Instrument | BTCUSDT (spot, Binance) |
| Timeframe | Daily (1D) |
| Tested window | 2021-08-01 to 2026-08-01 |
| Entry | CMO(20) crosses above zero |
| Exit | CMO(20) crosses below zero |
| Direction | Long only, no leverage |
| Initial capital | $10,000 |
| Position size | 100% of equity per entry |
| Fees | 0.1% taker, modeled |
| Data source | Kaiko via CoinQuant |
| Baseline | BTC Buy and Hold 1D 2021-2026 (same window) |
The Backtest Results
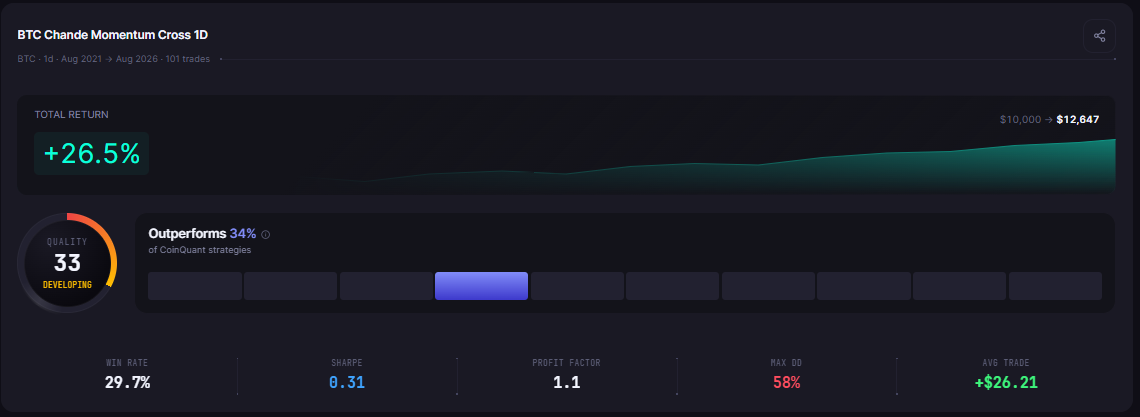
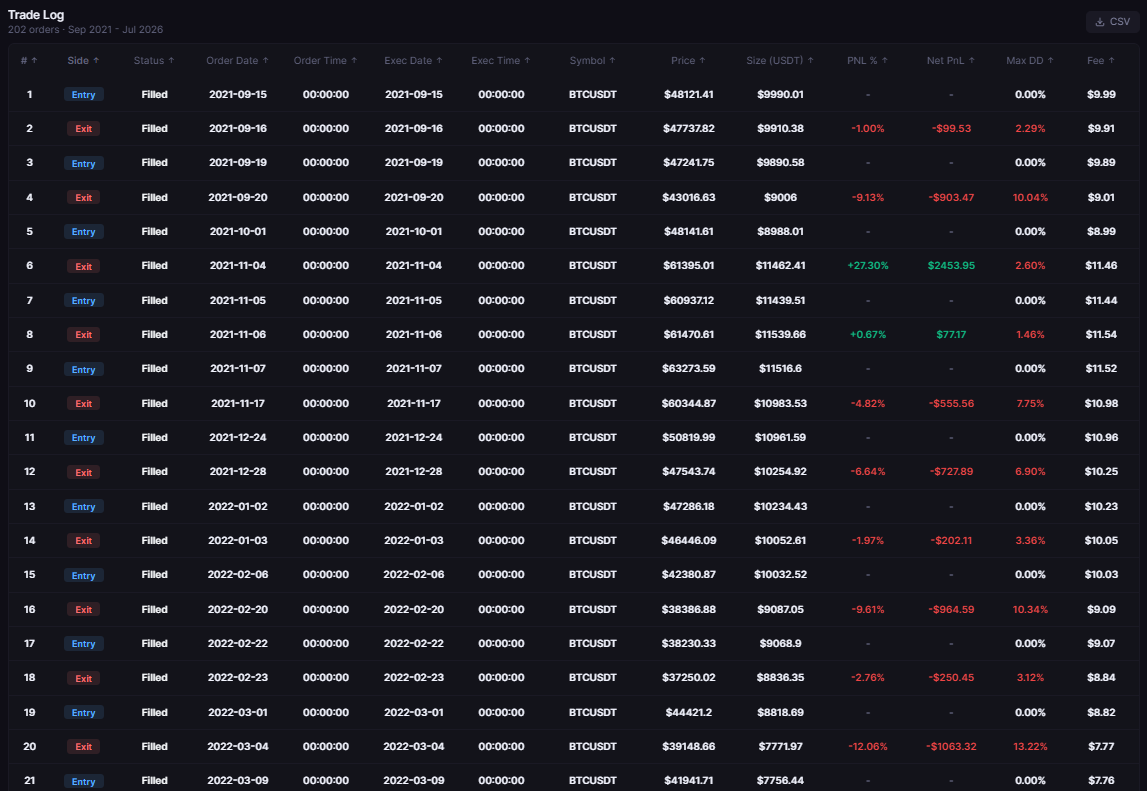
Over five years, the strategy turned $10,000 into $12,647.40. That is a +26.47% total return, produced by 101 trades, with the money in the market only about half the time.
| Metric | CMO Cross | Buy and Hold |
|---|---|---|
| Total Return | +26.47% | +57.33% |
| Final Balance | $12,647.40 | $15,733.43 |
| Total Trades | 101 | 1 |
| Win Rate | 29.7% (30W / 71L) | n/a (single hold) |
| Profit Factor | 1.10 | n/a |
| Sharpe Ratio | 0.31 | 0.44 |
| Sortino Ratio | 0.46 | 0.63 |
| Max Drawdown | 57.95% | 76.63% |
| Average Win | $948.47 | n/a |
| Average Loss | $363.47 | n/a |
| Best Trade | +$5,238.04 | n/a |
| Worst Trade | -$1,105.74 | n/a |
| Time in Market | 49.59% | 100% |
| Total Fees | $2,309.19 | $25.74 |
| CAGR | 4.81% | 9.48% |
What the Data Shows
The first finding is that the returns exist but are thin. A profit factor of 1.10 means the strategy made ten cents of gross profit for every dollar it lost, before considering how much it had to trade to get there. The 101 trades generated $2,309.19 in fees on a $10,000 account, which is nearly a quarter of the starting capital paid away in costs.
The second finding is the shape of the edge. The win rate is 29.7%, which sounds terrible until paired with the payoff ratio: the average win of $948.47 is 2.6 times the average loss of $363.47. This is a trend-following profile: many small cuts, a few large runs. The best trade alone, held from mid-October to late December 2024, added +$5,238.04 during Bitcoin's post-election rally. Strip out a handful of trades like that one and the picture darkens considerably.
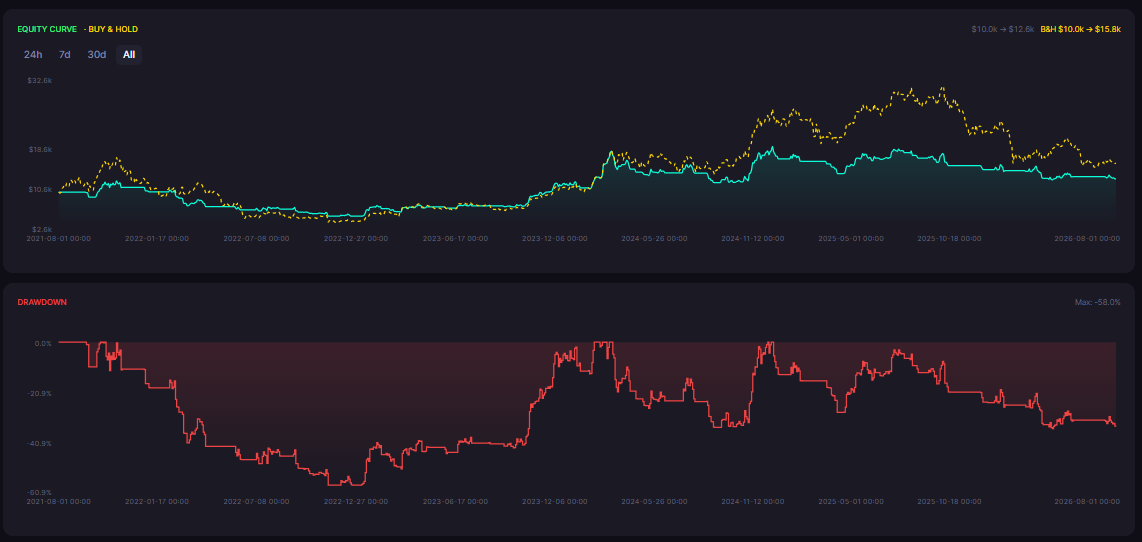
The third finding is the whipsaw tax. The longest losing streak ran 12 trades. With CMO crossing zero every few weeks, the strategy spent as much energy flipping in and out of positions as it did capturing trends. Every flip paid the fee line again.
Why the Zero-Line Cross Whipsaws on Bitcoin
A zero-line cross is the purest expression of momentum: positive momentum in, negative momentum out. The problem is that Bitcoin's daily momentum hovers near zero constantly, and CMO's unsmoothed math amplifies every wobble in that zone.
That produces a specific failure pattern. Quiet chop creates a cluster of small losses, then a real trend produces one large win that rescues the total. The year-by-year ledger from the trade data shows the mechanics clearly: profitable in 2021 (+$244.67), 2023 (+$6,208.80), and 2024 (+$5,286.44), and negative in 2022 (-$5,063.70), 2025 (-$2,170.60), and 2026 through August (-$1,858.17). The winning years came mostly from a handful of large trend captures, including the +$5,238.04 trade held from October to December 2024; the losing years were ground out trade by trade as momentum flipped back and forth.
Compare the outcome with the tested BTC RSI(14) mean reversion strategy in the same library, which is a different signal family but shows what a smoother, more selective approach produced on the same window: +55.69% with 13 trades, a 61.5% win rate, a profit factor of 3.04, and a 23.19% max drawdown. Fewer decisions, smaller wounds. The CMO crosses triggered more than seven times as many trades for less than half the return.
The Practical Lesson
The raw CMO(20) zero-line cross returned +26.47% on daily BTC over five years, less than half of buy and hold's +57.33%
It did reduce drawdown versus holding: 57.95% against 76.63%, but the return sacrifice was larger than the risk benefit
The edge profile is trend-following: 29.7% win rate carried by a 2.6 payoff ratio and a few large trades
101 trades and $2,309.19 in fees show the real cost of a fast, unfiltered signal on daily data
The CMO question has a data-backed answer for this window: the indicator's famous speed is exactly what makes the naked zero cross expensive on Bitcoin. The next tests worth running are the standard mitigations the indicator's own documentation suggests, such as requiring a trend filter like a 50-period EMA above the signal, or using CMO only as confirmation inside a slower system. Each version needs its own backtest before it earns a place in a live strategy.
Run this CMO backtest yourself and test your own momentum filters on CoinQuant. Backtest momentum strategies free on CoinQuant
BACKTEST VERIFIED: Article 262 Strategies (both BTCUSDT 1D, 2021-08-01 to 2026-08-01): BTC Chande Momentum Cross 1D 2021-2026 (strategy_version_id 514a53d2-3e0c-4144-9cf2-5757f56e8b84, backtest_id 4f9b6b09-a91a-4a2d-b8e0-e64127bd882e, TR +26.47%, 101 trades, 29.7% win, PF 1.10, Sharpe 0.31, DD 57.95%, fees $2,309.19, final $12,647.40); BTC Buy and Hold 1D 2021-2026 (strategy_version_id 041920f4-a649-4247-82fd-15b6c2b2bdda, backtest_id 6c76316d-ca56-4013-a54e-cf2d4ee4460b, TR +57.33%, 1 trade, Sharpe 0.44, DD 76.63%, final $15,733.43). All metrics confirmed via GET /v1/backtests/{id}/results on 2026-09-16.
Disclaimer:
Key Takeaway
