
9 and 21 EMA Crossover Strategy on XRP: Daily Backtest Results (2021-2026)

The 9/21 EMA crossover strategy is one of the most quoted fast EMA crossover crypto setups: buy when the 9-period EMA crosses above the 21-period EMA, sell when it crosses back. On daily XRP from August 2021 to August 2026, it lost money. The rule turned $10,000 into $5,956.27, a -40.44% Total Return across 39 trades, while simply holding XRP returned 46.13%.
The cross did not protect capital either. Its Max Drawdown was 79.07%, slightly deeper than the 77.87% of buy and hold, even though it sat in cash most of the time.
This article builds the rule in one sentence, runs five years of XRPUSDT daily data with a 0.1% fee on every fill and reports the results without adjustment. No tuned parameters, no cherry-picked dates.
Why the 9/21 EMA Crossover Strategy Is So Popular
An exponential moving average (EMA) weights recent prices more heavily than a simple average, so it turns faster. Pairing a 9-period EMA with a 21-period EMA gives a signal that is fast enough to catch swings and, in theory, slow enough to filter some noise.
- 9 EMA: the fast line, roughly two weeks of daily closes
- 21 EMA: the slow line, roughly a month of daily closes
- Signal: the fast line crossing the slow line marks a change in short-term trend
That speed is the appeal of the 9 and 21 EMA strategy, and it is what separates it from slower pairs. The 20/50 and 50/200 crossovers trade far less often, as the EMA 20/50 vs EMA 50/200 test on Bitcoin shows. Moving-average crossovers as a family also feature in the most popular crypto trading strategy of 2026, which is why a fast version deserves its own five-year test.
The Exact Rules We Tested
The strategy comes straight from Nada's CoinQuant Strategy Library as XRP EMA 9/21 Cross 1D 2021-2026. In CoinQuant you can describe it in plain English, for example: "Buy XRPUSDT on the daily chart when the 9 EMA crosses above the 21 EMA. Sell when it crosses back below." No coding required.
| Parameter | Setting |
|---|---|
| Strategy | XRP EMA 9/21 Cross 1D 2021-2026 |
| Instrument | XRPUSDT (spot, Binance) |
| Data source | Kaiko via CoinQuant |
| Timeframe | Daily (1D) |
| Tested window | 2021-08-01 to 2026-08-01 |
| First trade to last exit | 2021-10-06 to 2026-07-27 |
| Entry | EMA(9, Close) crosses above EMA(21, Close), market order |
| Exit | EMA(9, Close) crosses below EMA(21, Close), market order |
| Direction | Long only, one position at a time, no leverage |
| Initial capital | $10,000 |
| Position size | 100% of equity per entry |
| Fees | 0.1% taker fee on entry and on exit (no slippage set) |
| Baselines (same window) | XRP Buy and Hold 1D 2021-2026; BTC Buy and Hold 1D 2021-2026 |
There is no stop loss, no take profit and no trend filter. The rules panel shows exactly one entry condition and one exit condition, so what you see is what was tested.
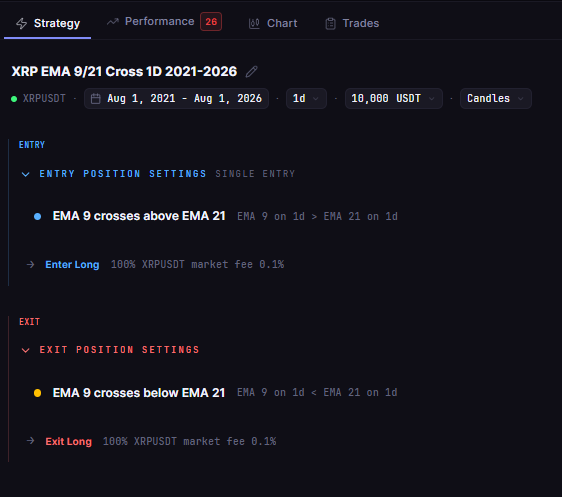
XRP EMA 9/21 Cross 1D 2021-2026 in the CoinQuant builder: one entry cross and one exit cross on daily XRPUSDT, built without code.
Results vs XRP Buy and Hold
Over the same five years, holding XRP beat this XRP EMA crossover by a wide margin, and holding Bitcoin did better still. Holding XRP turned the same $10,000 into $14,613.11.
| Metric | 9/21 EMA cross | XRP buy and hold | BTC Spot Comparison |
|---|---|---|---|
| Strategy | XRP EMA 9/21 Cross 1D 2021-2026 | XRP Buy and Hold 1D 2021-2026 | BTC Buy and Hold 1D 2021-2026 |
| Total Return | -40.44% | +46.13% | +57.33% |
| Final Balance | $5,956.27 | $14,613.11 | $15,733.43 |
| Total Trades | 39 | 1 | 1 |
| Win Rate | 23.08% (9W / 30L) | n/a (single hold) | n/a (single hold) |
| Profit Factor | 0.74 | n/a | n/a |
| Sharpe Ratio | 0.04 | 0.49 | 0.44 |
| Max Drawdown | 79.07% | 77.87% | 76.63% |
| CAGR | -9.84% | +7.88% | +9.48% |
| Time in Market | 38.19% | 100.00% | 100.00% |
| Total Fees | $460.59 | $24.62 | $25.74 |
All three runs share the same window, capital, sizing and 0.1% fee, so the rows compare like with like. Win Rate and Profit Factor are not shown for buy and hold because each benchmark is a single trade.
The Sharpe Ratio tells the same story: 0.04 for the crossover against 0.49 for holding XRP. Spending only 38.19% of the time in the market did not buy a smoother ride. CoinQuant's results summary for the strategy, below, shows the outcome at a glance: $10,000 became $5,956.27 over 39 trades.
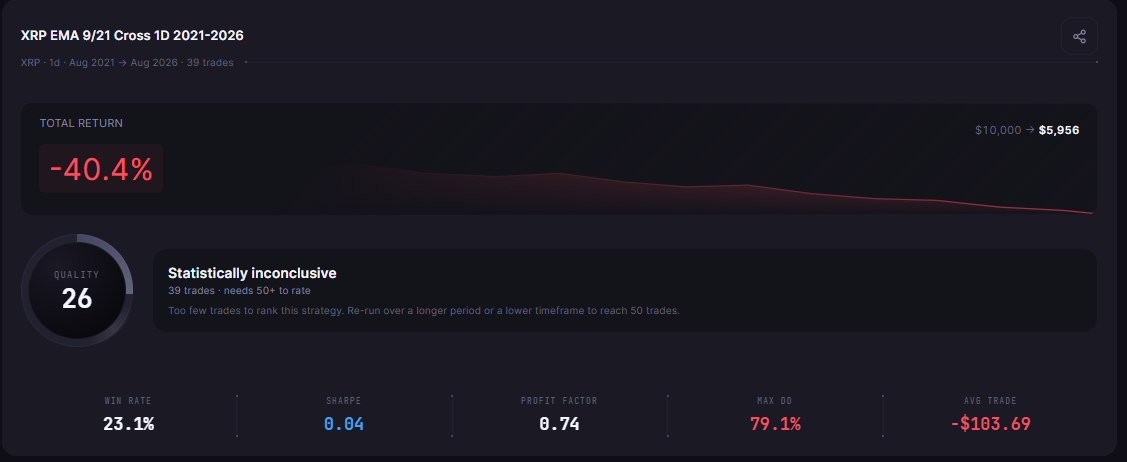
XRP EMA 9/21 Cross 1D 2021-2026 on XRPUSDT, 2021-08-01 to 2026-08-01: -40.44% Total Return over 39 trades, a 79.07% Max Drawdown, a Profit Factor of 0.74 and a 23.08% Win Rate.
Data note: the XRPUSDT daily series on CoinQuant is missing 2021-09-09 to 2021-09-15 (seven days), and the platform does not flag it. No fill falls inside the gap, but the first trade opened on 2021-10-06, 21 days after it, so its EMA values were computed across the missing days.
Whipsaws and Fees: Where the Losses Came From
Most Trades Lost
Only nine of the 39 trades made money, a Win Rate of 23.08%. The median trade returned -5.47% after fees, and the strategy suffered a run of eight losing trades in a row.
The winners were larger on average, $1,275.25 against an average loss of $517.37. That was not enough: a Profit Factor of 0.74 means the rule earned 74 cents of gross profit for every dollar of gross loss.
| Trade breakdown | XRP EMA 9/21 Cross 1D 2021-2026 |
|---|---|
| Winning / losing trades | 9 / 30 |
| Average win / average loss (after fees) | +40.42% / -8.26% |
| Median trade (after fees) | -5.47% |
| Longest losing streak | 8 trades |
| Average holding period | 17.82 days |
The payoff profile is classic trend following: small, frequent losses waiting for a rare large win. It only works when the large wins come often enough, and on daily XRP they did not.
One Trade Supplied More Than Half the Profit
The best trade bought XRP on 2024-11-08 and sold on 2024-12-29 for +$6,283.15, a 277.74% return after fees. That single trade supplied more than half of all gross profit, and the other 38 trades together lost more than it made.
The worst trade in dollars ran from 2021-12-23 to 2021-12-29 and lost $1,660.94 (-18.00% after fees). The largest percentage loss was -23.05% after fees, from 2023-07-13 to 2023-08-05.
Whipsaws, Not Fees, Did Most of the Damage
A whipsaw is a cross that reverses within days. Eight trades lasted five days or fewer, and all eight lost money. Every one paid a full round trip of fees for a signal that was gone almost as soon as it arrived.
Fees totalled $460.59, against a net loss of $4,043.73. So fees deepened the loss, but most of it came from buying after a short rise and selling after the drop that followed.
What This Test Cannot Tell You
This 9/21 EMA backtest covers one asset, one window and one pair of settings. A different coin, a 4-hour chart or a trend filter could change the result, and none of those were tested here. The test answers one question well: did this exact rule beat holding XRP over these five years?
- Sample: 39 trades over five years hints at a pattern but is not a verdict. CoinQuant's own quality check marks this run "Statistically inconclusive" because it needs 50 or more trades to rate a strategy
- Costs: fees are modelled at 0.1% per fill, but slippage was not set, so real fills could be slightly worse
- Concentration: one trade supplied more than half of the gross profit, which makes the result sensitive to a single move
- Data: the seven-day XRP gap in September 2021 affects the EMA values before the first trade
Past results do not predict future returns. For other ways to trade XRP, see three XRP approaches backtested during the June 2026 selloff.
The Practical Lesson
A popular setup is not a tested setup. On daily XRP from 2021 to 2026, the 9/21 EMA crossover strategy lost money while the coin itself rose.
- Return: -40.44% for the crossover against +46.13% for holding XRP and +57.33% for holding Bitcoin
- Risk: a 79.07% Max Drawdown, no better than buy and hold's 77.87%
- Edge: a 23.08% Win Rate and a Profit Factor of 0.74, with one trade supplying more than half of the gross profit
- Cause: fast crosses on a daily chart produced short losing trades, each paying fees
The useful next step is to test what slows the signal down. In CoinQuant, an AI trading platform, you can try a slower pair such as the one in seven years of EMA crossover data on Bitcoin, add a higher-timeframe trend condition (CoinQuant supports multi-timeframe and multi-indicator conditions) or run the same rule on another asset. Each change needs its own backtest.
Build trading strategies on real data. No coding required.
Frequently Asked Questions
Does the 9 and 21 EMA crossover strategy work on XRP?
Not in this test. On daily XRPUSDT from 2021-08-01 to 2026-08-01 it returned -40.44% over 39 trades, while holding XRP returned 46.13% on the same window and fees.
Is the 9/21 EMA crossover good for the daily chart?
On daily XRP it produced many short, losing trades: nine winners out of 39 and a Profit Factor of 0.74. A fast pair reacts to noise on any chart, so test it on your own asset and timeframe before you trust it.
Which EMA crossover settings work best for crypto?
No single setting wins everywhere, and this test covers only 9/21 on XRP. Slower pairs trade less often and pay fewer fees, but they still need their own backtest on the coin and window you plan to trade.
Test the 9/21 cross on your own coin and window before you trade it.
Disclaimer:
Key Takeaway