XRP Trading Strategy: 3 Approaches Backtested During the June 2026 Selloff
.png)
XRP holders have been under pressure since March 2026. Glassnode data shows capitulation events across the XRP holder base, with long-term holders moving into loss for the first time since the 2024 cycle low. The selloff intensified through May as broader crypto market risk-off sentiment accelerated, with XRP underperforming Bitcoin by a significant margin during the sharpest decline weeks.
For traders trying to navigate this environment with a rules-based approach, the question is direct: which strategy types hold up when XRP is falling?
The instinctive answer (that you need a short-side or volatility strategy) is not always accurate when trading rules must work within long-only or no-leverage constraints. This backtest covers three common approach types across the same period and reports the results without adjustment.
Why XRP Selloffs Create a Specific Testing Problem
XRP moves differently from Bitcoin during risk-off periods. It tends to fall faster and recover more sharply, driven by retail sentiment, regulatory news, and Ripple ecosystem developments rather than the macro flows that dominate BTC.
A sharp drop in XRP during a risk-off event is typically not a smooth, single-direction trend: it is a series of rapid drops punctuated by brief sharp recoveries as retail sentiment shifts on news. That volatility profile has specific implications for strategy selection.
Trend-following strategies need a persistent directional move to generate profits. In an environment characterized by volatile recoveries and renewed selling, that persistence is rarely present, creating frequent false entries for trend-following approaches. A strategy that works on BTC daily data often performs very differently on XRP during the same period.
This test ran three common approach types on XRPUSDT 4-hour data from March 1, 2026 to June 1, 2026, covering the full selloff period. The four-hour timeframe was selected because it captures intraday volatility without the noise of shorter intervals, and because XRP's recovery moves during selloffs tend to develop over four-to-twelve hour windows, a range that the 4H candle structure can detect.
All three strategies used the same instrument, timeframe, data source, fee structure, and initial capital base. The only variable is the strategy logic, which allows the result differences to be attributed directly to strategy type rather than testing conditions.
The Three Strategies Tested
Backtest Results: March 2026 to June 2026
Data sourced through Kaiko via CoinQuant. Fees at 0.1% per trade. No leverage. Initial capital $10,000.
What the Data Shows
Approach 1: RSI Oversold Recovery
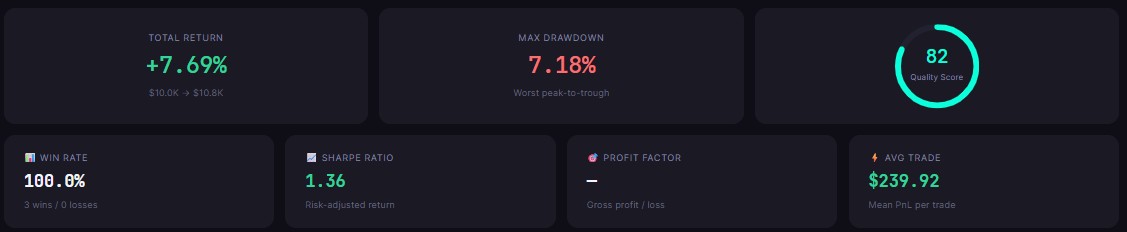
RSI oversold recovery was the only approach that generated a positive return during the selloff period: +7.69% across three trades and a 100% win rate. The reason is structural.
Mean reversion strategies are designed for exactly the market condition XRP experienced during this period: extreme directional moves that overshoot fair value and then partially reverse. A sharp drop in RSI to below the oversold threshold signals that selling pressure has been extreme.
In XRP's case, each of these readings was followed by a recovery move large enough to generate a profitable exit before the downtrend resumed. The strategy does not try to catch the bottom permanently: it catches the bounce from the capitulation low and exits before the next leg down. That is the appropriate mechanical response to a volatile, non-directional selloff characterized by sharp drops and brief recoveries.
The Sharpe Ratio of 1.36 confirms the RSI strategy delivered strong risk-adjusted returns: for every unit of volatility absorbed, the strategy generated meaningful positive return. The undefined Profit Factor reflects that there were no losing trades at all: gross losses were zero, making the ratio mathematically undefined rather than infinite. Each average trade returned $239.92.
Three caveats apply for interpreting this result:
Three trades is a small sample
100% win rates do not persist at scale
This regime specifically rewarded mean reversion
Extending this test across a full market cycle (including the bull phases where XRP made extended sustained moves upward) would likely show a different result profile. That is precisely the point: this test is designed to show regime-specific behavior, not to claim the RSI strategy is universally superior.
Approach 2: EMA Crossover (21/55)
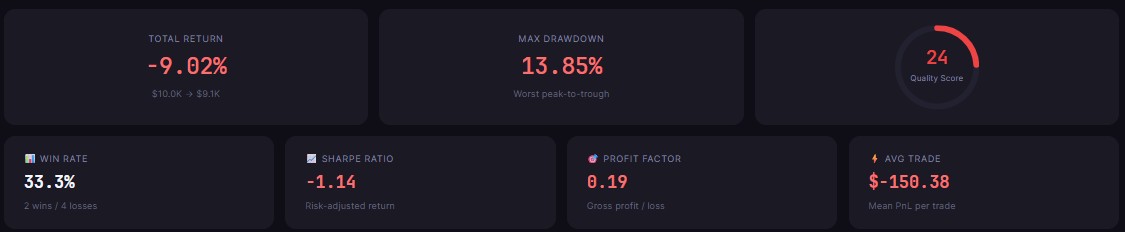
EMA crossover lost -9.02% across six trades. In a trending downward market, the 21/55 crossover fired multiple entries that were immediately underwater. The 33.3% win rate reflects the difficulty of finding an uptrend to follow when the primary direction is down.
The Sharpe Ratio of -1.14 means the strategy produced negative risk-adjusted returns for every unit of volatility it absorbed. The Profit Factor of 0.19 is the starkest number: for every $1.00 lost, the strategy generated only $0.19 in gross profit. The average trade lost $150.38: each position was costly relative to its size.
Adjusting the EMA periods (using a shorter fast period to react more quickly, or adding a trend filter that only allows entries when price is above a long-term moving average) would likely reduce trade count and could improve the win rate. But those adjustments would need to be backtested to confirm, and this specific window was structurally hostile to any trend-following approach regardless of parameter settings.
Approach 3: MACD
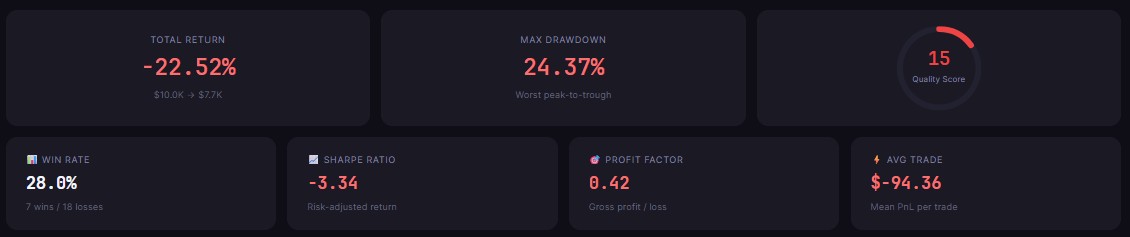
MACD was the weakest performer: -22.52% and 25 trades. MACD responds quickly to short-term momentum shifts, generating a high trade count on a volatile asset during a selloff. Each false recovery fired an entry, and most reversed when the downtrend resumed.
A Sharpe Ratio of -3.34 is among the worst outcomes possible: extreme negative risk-adjusted return, meaning the strategy consistently took on volatility with no compensation. The Profit Factor of 0.42 and average trade loss of -$94.36 across 25 trades compounded into the largest portfolio decline.
The high trade count is itself a warning signal in this context. Twenty-five trades over three months on a 4-hour chart indicates the strategy was reacting to noise rather than sustainable momentum shifts.
Adding a higher-timeframe trend filter (such as requiring the daily MACD to be in positive territory before executing a 4H entry) would reduce trade count significantly and filter out many of the false entries that drove the large loss.
The Practical Lesson
This backtest is not a recommendation to use RSI on XRP. It is a demonstration of how strategy type interacts with market regime.
Mean reversion won during a capitulation selloff because the market structure produced the exact conditions it needs: extreme moves that partially reverse. Trend following and momentum strategies underperformed because there was no sustained uptrend to follow.
The failure was not in the indicators themselves: EMA crossovers and MACD are well-established tools that work in the right conditions. The failure was in the mismatch between strategy type and market structure. Identifying that mismatch before deployment, rather than after, is the function of rigorous backtesting.
The Quality Scores reflect this directly: RSI scored 82, EMA 24, MACD 15. These scores factor in return, drawdown, and consistency, not just win rate.
A high win rate on three trades scores differently than 25 trades with a 28% win rate and a Sharpe below -3. The score is designed to surface strategies that are not just profitable in aggregate but reliable trade-by-trade.
A strategy that scores 82 on three trades is being graded conservatively: the sample size discount is built in. The gap between 82 and 15 in this test is meaningful: it reflects a fundamental difference in how each strategy type handled the same market environment, not a marginal performance difference.
In a bull market environment where XRP is making sustained uptrends, EMA and MACD strategies typically outperform mean reversion approaches. The regime determines the strategy, not the asset.
The same MACD configuration that generated a -3.34 Sharpe during a selloff may produce a positive Sharpe in a sustained breakout environment where momentum persists for multiple weeks.
Backtesting across multiple market conditions (bull phases, bear phases, sideways consolidation periods) is the only way to understand which approaches are robust and which depend on one specific environment. A strategy that only backtests well in one regime is not a validated strategy; it is a regime-specific result that needs to be tested across a full market cycle before any deployment decision is made.
Run these XRP backtests yourself and test additional combinations on CoinQuant. Start free on CoinQuant
Disclaimer:
This content is for educational and informational purposes only and does not constitute financial, investment, or trading advice. All strategies and examples are for illustrative purposes and do not guarantee results. Always conduct your own research before making financial decisions.
Key Takeaway