
Ulcer Index or Max Drawdown? Six Coins Ranked Both Ways
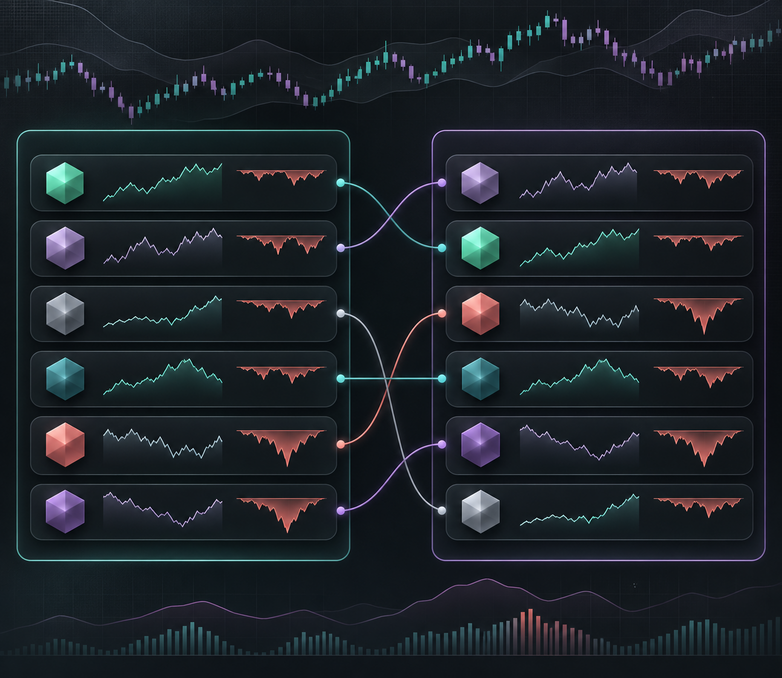
In CoinQuant's Buy and Hold backtests from 2021 to 2026, Solana had the deepest fall (96.27%) but recovered, so its Ulcer Index (63.35) is far below Cardano's (80.07), which never came back. Max Drawdown shows the worst moment; the Ulcer Index shows how long it hurt.
In trading, the ulcer index is a risk number, not a medical term: it measures how deep and how long an account stays below its last high. It matters in 2026 because many holders are sitting inside a long drawdown: Bitcoin closed on 5 November 2026 38.96% below its highest daily close (Binance BTCUSDT, UTC daily closes).
This article sets the criteria first and ranks six coins by Max Drawdown and by the Ulcer Index on CoinQuant, an AI trading platform. It reports the results without adjustment. Each coin is a plain Buy and Hold backtest on the same five year window.
Criteria First: What Max Drawdown and the Ulcer Index Measure
Both numbers start from the same idea. At every point in the test, the drawdown is how far the account sits below its highest value so far.
- Max Drawdown is the single deepest of those readings. It records the worst moment and nothing else. It does not change if the account recovered the next week or never recovered at all.
- The Ulcer Index takes every daily drawdown in the window, squares each one, averages them and takes the square root. Days at a new high count as zero. Long stretches far below the high push the number up; quick dips barely move it.
Squaring gives deep readings more weight than shallow ones, and averaging over the whole window rewards time spent back at a high. So the Ulcer Index blends depth and length into one number. We recomputed it from each backtest's saved drawdown curve and it matched CoinQuant's figure on all six coins.
| Criterion | Max Drawdown | Ulcer Index |
|---|---|---|
| What it measures | The deepest fall from a high | Depth and length of every fall, averaged |
| Sees how long it lasted | No | Yes |
| Sees smaller falls | No, only the worst one | Yes, every day under water |
| Easy to read in one line | Yes, as a percentage | Harder, as an index |
| Where to find it on CoinQuant | Detailed Statistics, Max DD | Detailed Statistics, Ulcer Index |
The Answer First
The same five years of data tell two stories depending on the number you read.
By Max Drawdown, Solana was the worst coin to hold: it fell 96.27% from its high, slightly deeper than Cardano's 95.15%. By the Ulcer Index, Cardano was clearly worse, 80.07 against Solana's 63.35.
The reason is time. Solana peaked on 6 November 2021, hit bottom on 29 December 2022 and was back at a new high on 18 January 2025, 1,169 days after the peak. Cardano peaked on 3 September 2021 and was still below that high when the test ended on 1 August 2026, 1,793 days later. Its lowest point came on 25 June 2026, near the end of the window.
So the two coins had almost the same worst moment but very different years. Those results come from Buy and Hold backtests on CoinQuant, and the second number is the one that shows the difference.
Six Coins Ranked Both Ways
All six backtests use the same settings: $10,000, one buy on 1 August 2021, one sell on 1 August 2026, daily candles and a 0.1% taker fee on the entry and the exit (no slippage modelled).
| Strategy | Max Drawdown | Rank by Max Drawdown | Ulcer Index | Rank by Ulcer Index | Days from peak to a new high |
|---|---|---|---|---|---|
| SOL Buy and Hold 1D 2021-2026 | 96.27% | 1 (deepest) | 63.35 | 2 | 1,169 |
| ADA Buy and Hold 1D 2021-2026 | 95.15% | 2 | 80.07 | 1 (worst) | Not recovered (1,793 days to the window end) |
| ETH Buy and Hold 1D 2021-2026 | 79.30% | 3 | 50.25 | 4 | 1,383 |
| XRP Buy and Hold 1D 2021-2026 | 77.87% | 4 | 54.21 | 3 | 1,173 |
| BTC Buy and Hold 1D 2021-2026 | 76.63% | 5 | 41.54 | 6 (mildest) | 847 |
| BNB Buy and Hold 1D 2021-2026 | 69.85% | 6 (shallowest) | 41.81 | 5 | 939 |
The two rankings disagree in three places:
- Solana and Cardano swap places. Solana fell deepest but came back; Cardano stayed under water to the end.
- Ether and XRP swap places. XRP's worst fall was shallower, 77.87% against 79.30%, yet its Ulcer Index is higher, 54.21 against 50.25. Across the window, XRP spent more of its time further below its high.
- Bitcoin and BNB swap places. BNB had the shallowest worst fall, 69.85%, but Bitcoin had the lowest Ulcer Index, 41.54. Bitcoin was back at a new high after 847 days, the fastest of the six.
No coin was spared. All six fell more than two thirds from a high at some point, and none was at a high on the last day of the test. Bitcoin, the mildest by the Ulcer Index, ended the window 49.65% below its peak.
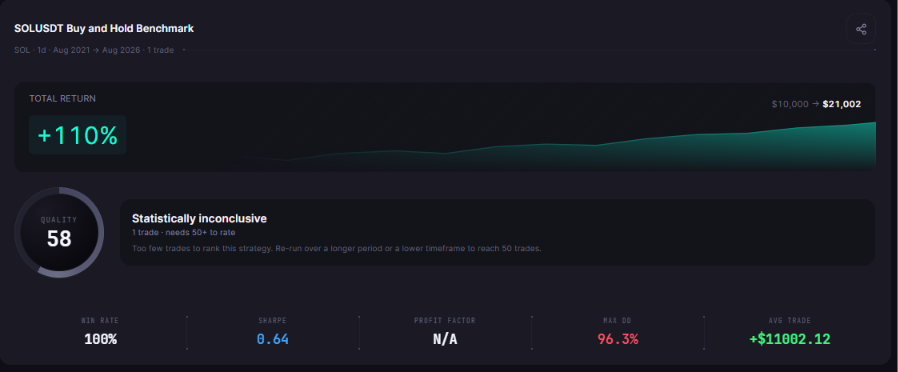
SOL Buy and Hold 1D 2021-2026 (shown in the app as SOLUSDT Buy and Hold Benchmark), tested from August 2021 to August 2026: one trade, +110%, $10,000 to $21,002, QUALITY 58 next to "Statistically inconclusive" and MAX DD 96.3%.
Where Each Number Is Better, and Where It Misleads
Max Drawdown is better at one job: it tells you the worst loss you would have had to sit through. If you held through a fall of 96.27%, each dollar at the high was worth less than four cents at the low. That is the number to check before you size a position.
It misleads when two falls look alike. Solana and Cardano are about one point apart on Max Drawdown, but the Solana holder saw a new high in January 2025 and the Cardano holder never did. Max Drawdown also ignores every smaller fall after the worst one.
The Ulcer Index is better at describing the whole ride. A strategy that dips hard and recovers fast scores lower than one that sinks slowly and stays down. For comparing two strategies on the same window, that is often closer to what holding them felt like.
It misleads in its own way. It is an index, not a percentage, so a reading of 63.35 is hard to picture on its own. It also depends on the window: a test that starts at a market top will score worse than one that starts at a low, even for the same coin. And it hides the single worst moment, which still matters if you need the money back.
The fair way to use them is together, on the same window. That is the same logic as in Sharpe Ratio vs Sortino Ratio, where two risk numbers answer different questions, and in Total Return vs Return to Drawdown, where the ranking changes with the number you sort by. For Max Drawdown on its own, see how to read Maximum Drawdown in crypto trading.
Both numbers sit in the same Detailed Statistics table on every CoinQuant backtest.
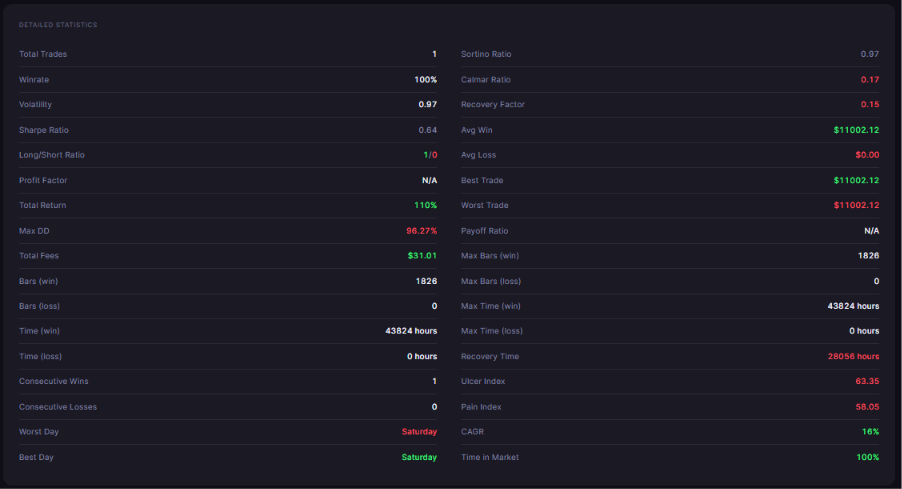
SOL Buy and Hold 1D 2021-2026 (shown in the app as SOLUSDT Buy and Hold Benchmark) in Detailed Statistics on CoinQuant: the Max DD and Ulcer Index rows.
Keep the limits in view:
- Costs: fees included (0.1% taker fee on entry and exit); no slippage modelled.
- Structure: each test buys once and sells once; no leverage.
- Scope: six coins, one five year window. A different start date would change both numbers.
- The future: past results do not predict future results.
The Practical Lesson
- Read Max Drawdown for the worst moment: Solana fell 96.27% and Cardano 95.15%.
- Read the Ulcer Index for how long it lasted: Cardano scored 80.07 and Solana 63.35.
- Compare on the same window: both numbers change with the start date.
Compare strategies on both numbers: the one with the lower Ulcer Index is usually the one you can actually sit through. On CoinQuant you can test a rule against Buy and Hold on the same window and read both numbers in Detailed Statistics, with no coding required.
Build trading strategies on real data. No coding required.
Frequently Asked Questions
What is the Ulcer Index in trading?
It is a risk number that measures how deep and how long an account stays below its last high. It squares each daily drawdown, averages them over the window and takes the square root, so long, deep periods under water score higher.
What is a good Ulcer Index?
Lower is better, and there is no fixed cut off. Compare it only across tests on the same window. In this test the six coins ranged from 41.54 for Bitcoin to 80.07 for Cardano.
Where do I find it on CoinQuant?
Open a backtest, go to the Performance tab and look in Detailed Statistics. The Ulcer Index sits in the same table as Max DD, so you can read both for any strategy.
Rank your own strategies by both numbers on the same window.
Disclaimer:
This content is for educational and informational purposes only and does not constitute financial, investment, or trading advice. All strategies and examples are for illustrative purposes and do not guarantee results. Always conduct your own research before making financial decisions.