
Linear Regression Strategy Backtest on Solana: What the Trendline Cross Shows
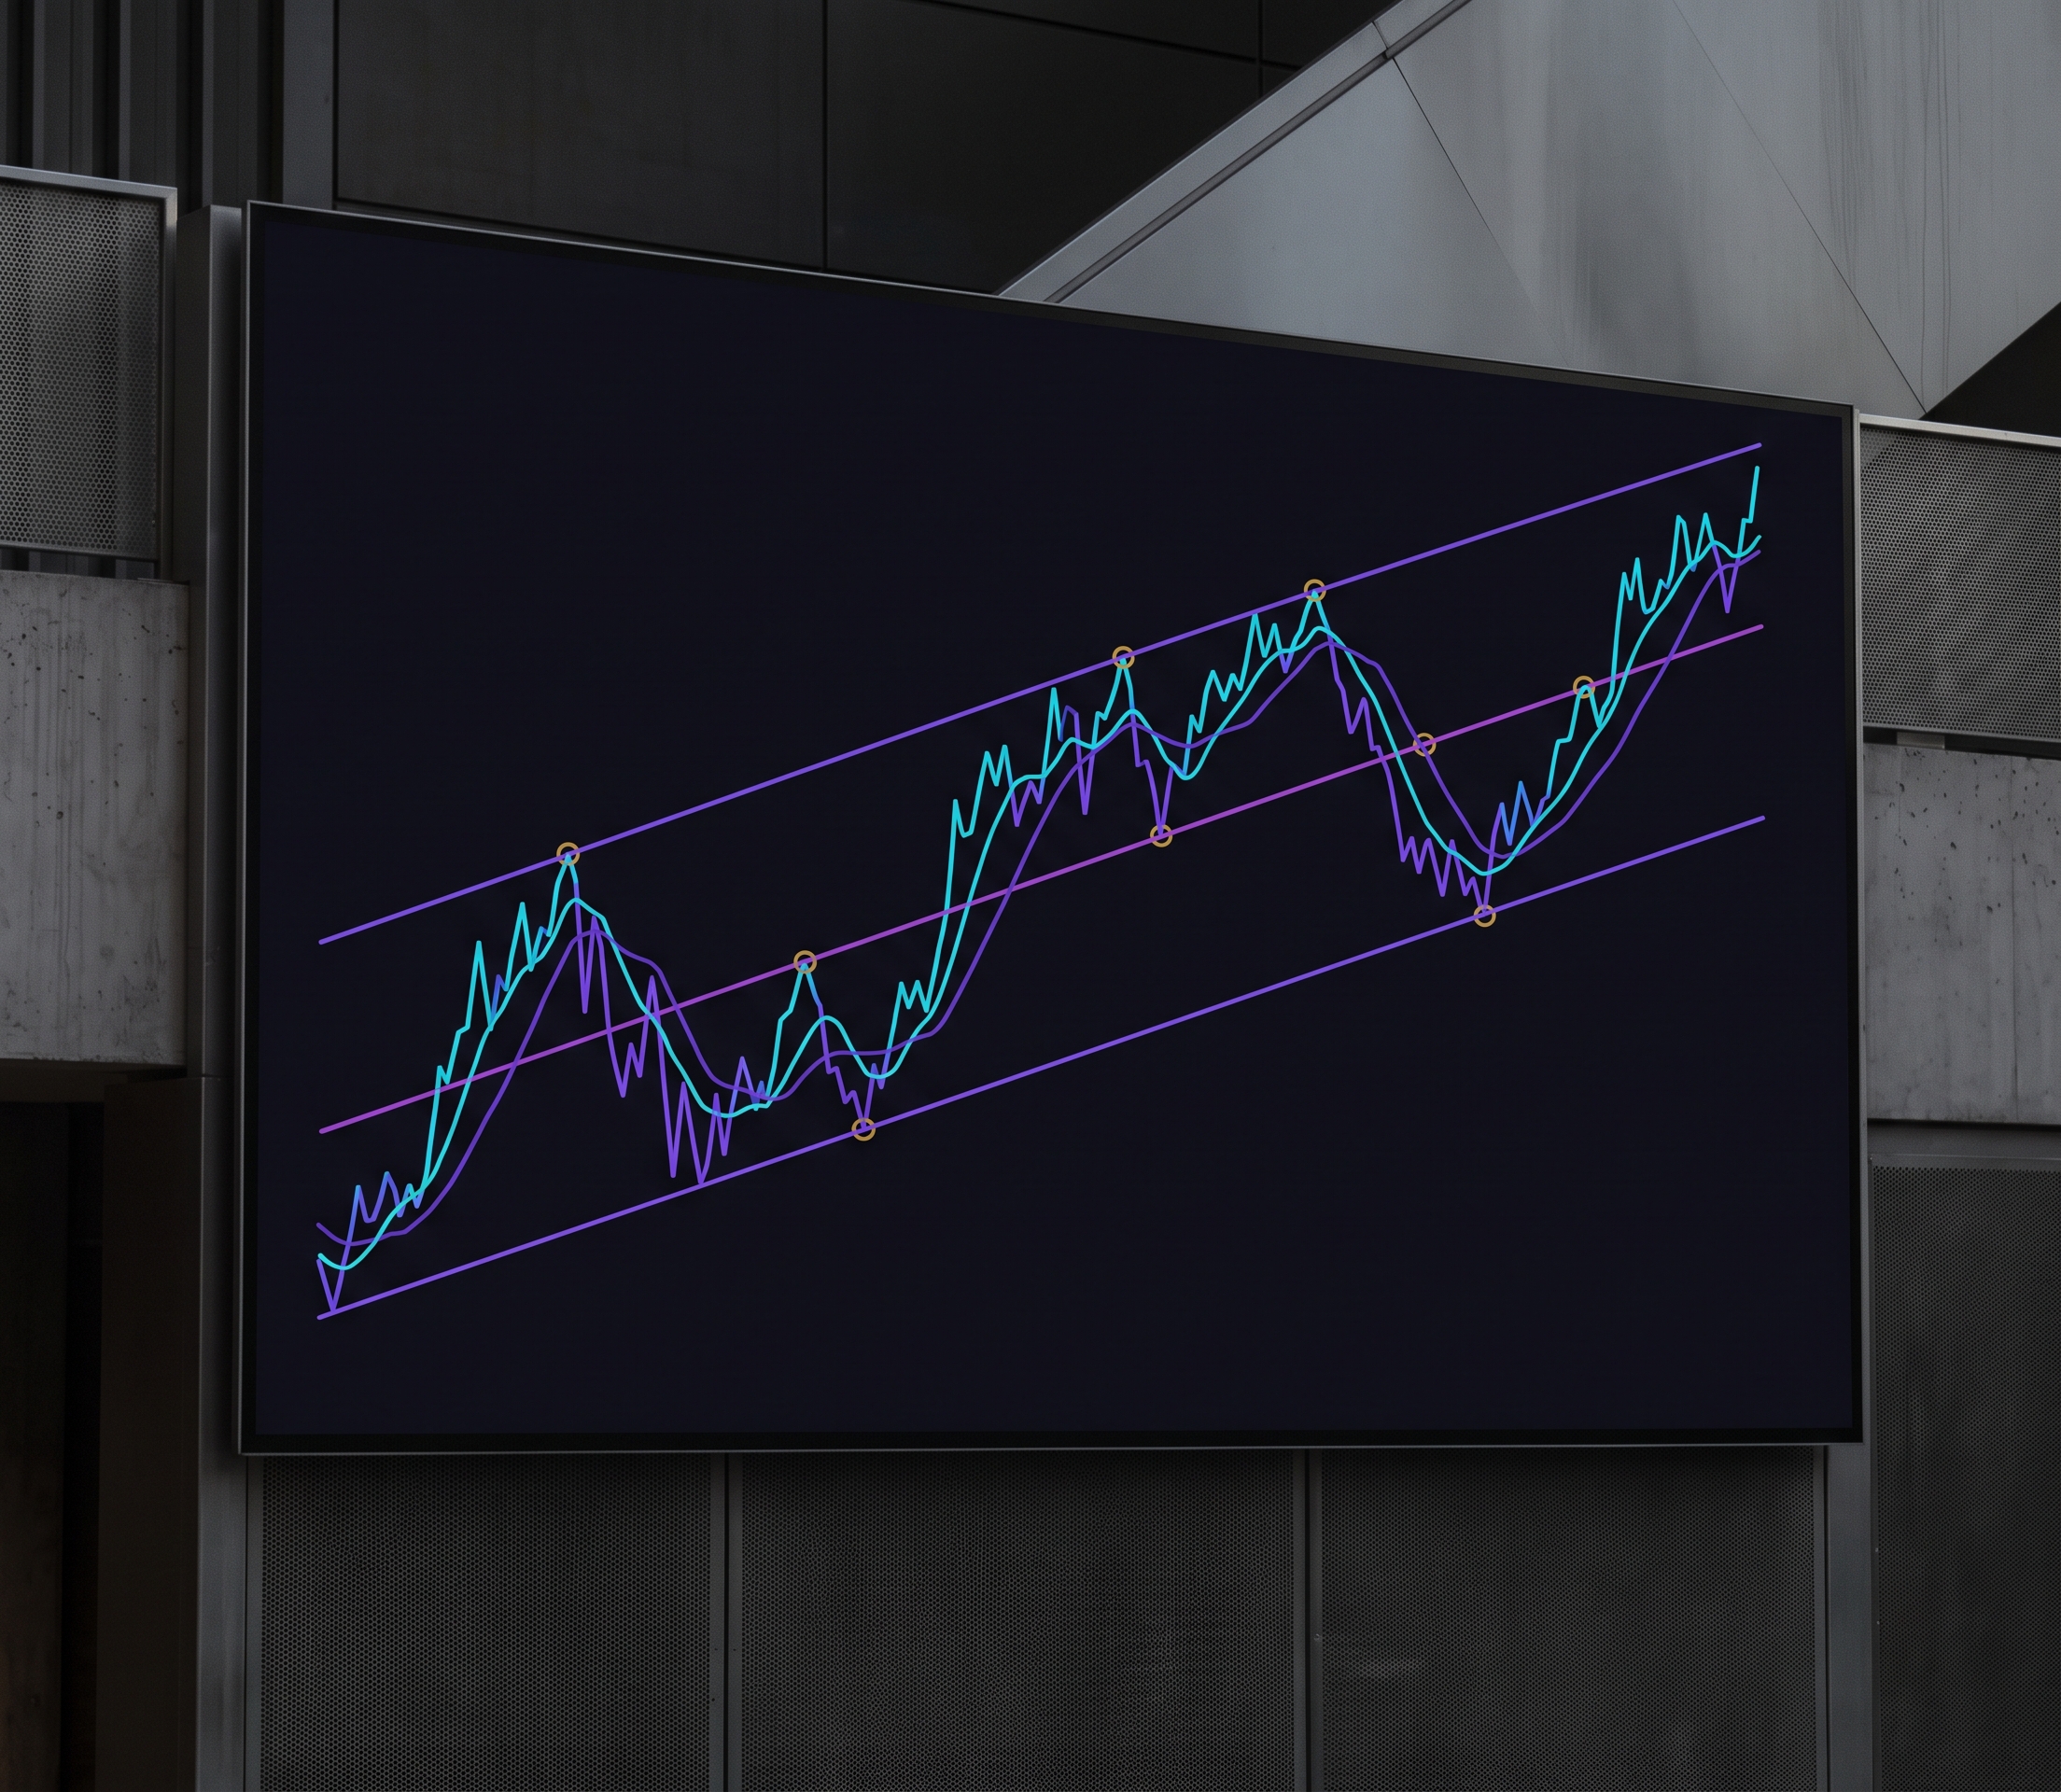
Draw a straight line through the last hundred closes and you get something a moving average cannot give you: direction with a slope attached. The linear regression line is the best-fit line of recent price, and when price crosses it, the market is telling you the fit just broke.
A linear regression trading strategy is popular on Solana charts because SOL does nothing halfway. It trended from about $21 to about $71 in late 2023, ran to the $200s in 2024, and spent 2025 and 2026 giving a large part of it back. This article tests whether a mechanical cross of price and its regression trendline turns that volatility into an edge, or whether it is another lagging-average clone with a fancier name.
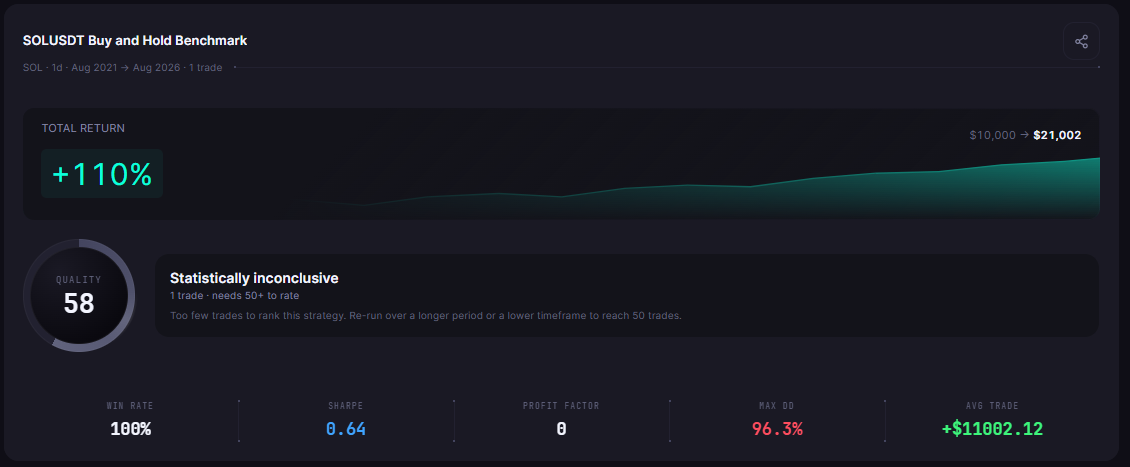
The test: a single strategy on SOLUSDT daily, August 2021 to August 2026, fees modeled, measured against simply holding Solana, whose buy-and-hold benchmark was created alongside for an exact same-window comparison.
What the Linear Regression Trading Strategy Actually Does
The indicator fits a straight line through the last 100 closes and plots its current value, re-fitting with every new bar. Price above the line means recent trade sits above its own trend; price below means the opposite. Crossings of the line are the turning points of that fit, and traders read them as a change in who is in control.
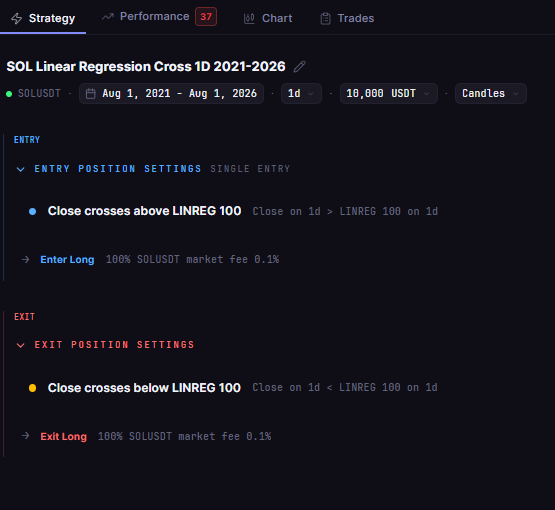
This test uses the simplest available reading:
- Entry: close crosses above the 100-period linear regression line
- Exit: close crosses below the 100-period linear regression line
Long only, one position at a time, no leverage, on SOLUSDT daily. No filters, no stops. If the regression line is a better trend guide than a plain average, this construction should show it on an asset this volatile.
Test Setup
| Parameter | Setting |
|---|---|
| Strategy | SOL Linear Regression Cross 1D 2021-2026 |
| Instrument | SOLUSDT (spot, Binance) |
| Timeframe | Daily (1D) |
| Tested window | 2021-08-01 to 2026-08-01 |
| Entry | Close crosses above the linear regression line (period 100) |
| Exit | Close crosses below the linear regression line (period 100) |
| Direction | Long only, no leverage |
| Initial capital | $10,000 |
| Position size | 100% of equity per entry |
| Fees | 0.1% taker, modeled |
| Data source | Kaiko via CoinQuant |
| Baseline | SOL Buy and Hold 1D 2021-2026 (same window) |
The Backtest Results
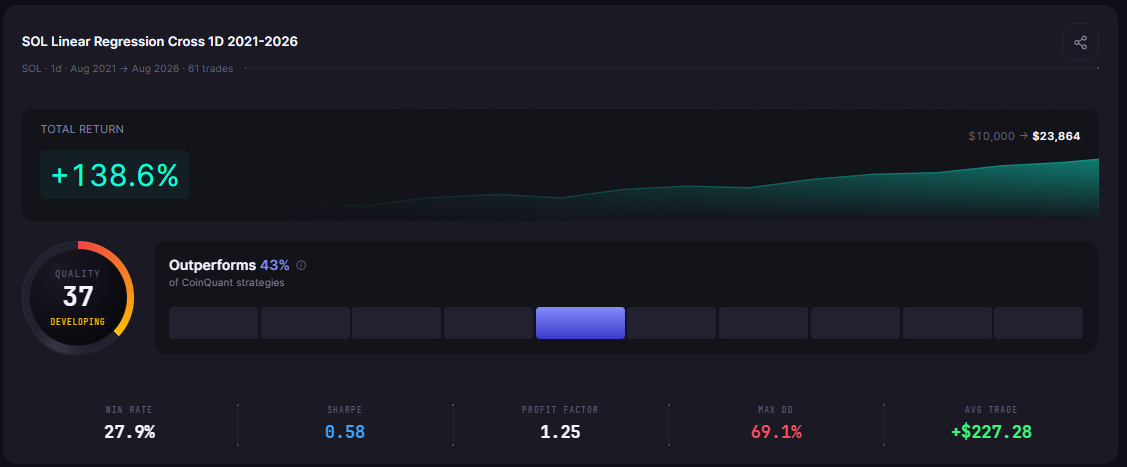
The regression cross turned $10,000 into $23,864.27, a +138.64% return from 61 trades, while Solana buy and hold finished at +110.02% over the same window.
| Metric | Strategy | Buy and Hold |
|---|---|---|
| Total Return | +138.64% | +110.02% |
| Final Balance | $23,864.27 | $21,002.12 |
| Total Trades | 61 | 1 |
| Win Rate | 27.9% (17W / 44L) | n/a (single hold) |
| Profit Factor | 1.25 | n/a |
| Sharpe Ratio | 0.58 | 0.64 |
| Sortino Ratio | 0.95 | 0.97 |
| Max Drawdown | 69.12% | 96.27% |
| Average Win | $4,142.41 | n/a |
| Average Loss | $1,285.38 | n/a |
| Best Trade | +$17,327.89 | n/a |
| Worst Trade | -$6,561.74 | n/a |
| Time in Market | 46.41% | 100% |
| Total Fees | $2,717.37 | $31.01 |
| CAGR | +18.99% | +15.99% |
What the Data Shows
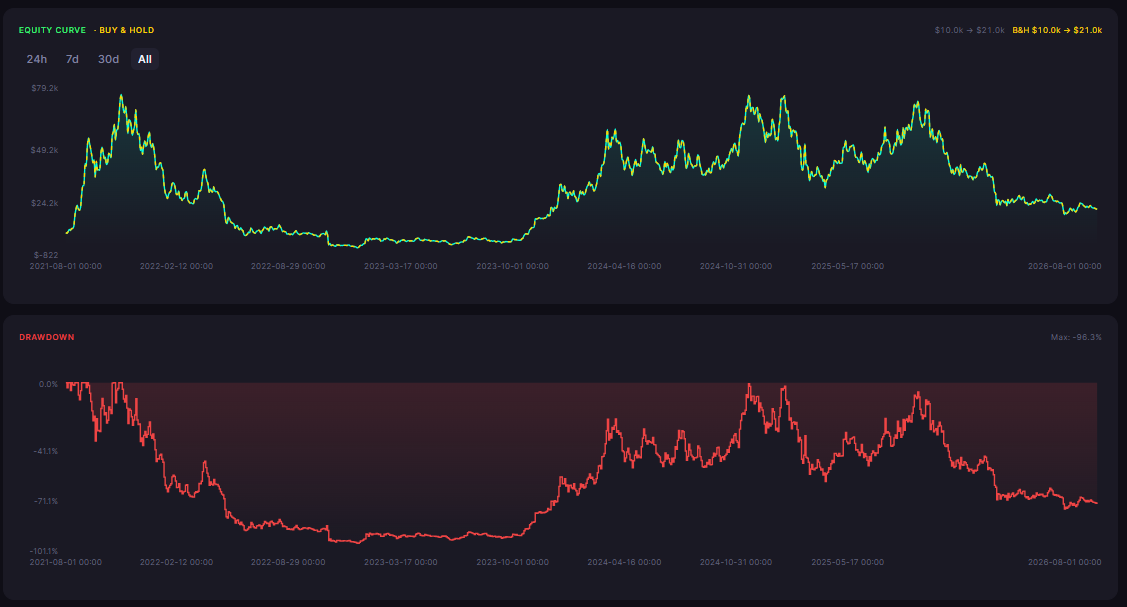
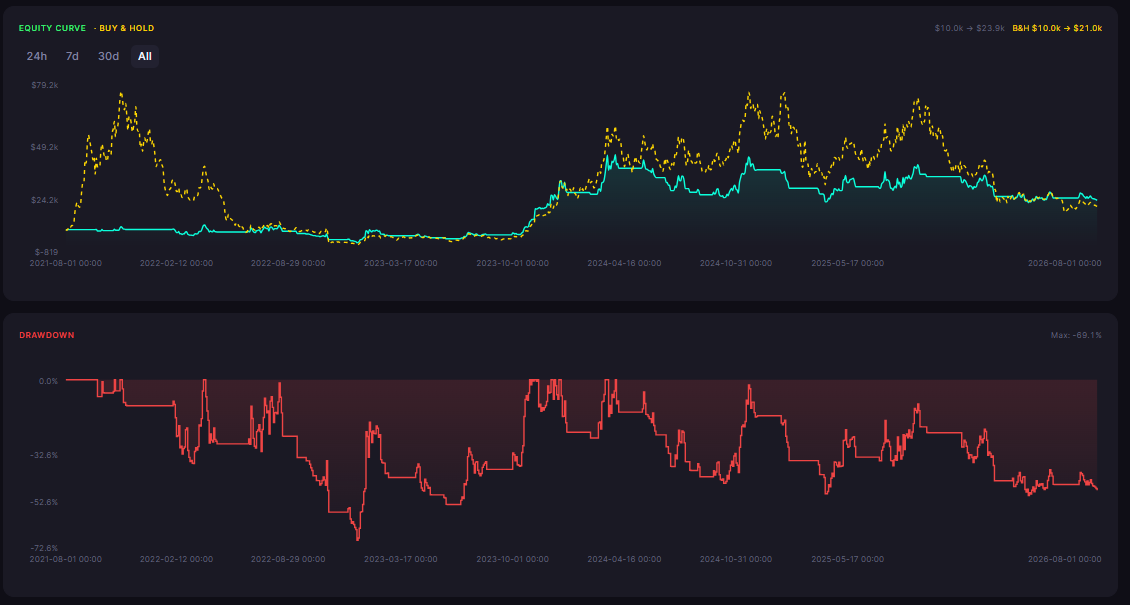
The first finding: the trendline beat holding on both of the numbers that matter most. Final balance, +138.64% against +110.02%, and worst-case pain, a 69.12% maximum drawdown against buy and hold's 96.27%. On an asset that fell more than 90% from its 2021 peak in the prior cycle, shaving 27 points off the drawdown while finishing ahead is not a cosmetic win.
The second finding is the trade signature, and it is classic trend following. The win rate is only 27.9%: 44 losers against 17 winners. What pays for those losers is scale. The average win was $4,142.41 against an average loss of $1,285.38, a ratio of more than three to one, and the single best trade made $17,327.89 by riding Solana from about $21 to about $71 between September and December 2023. One enormous leg, a handful of good ones, many small cuts.
The third finding is the year ledger, which shows exactly where the money was made and lost. 2023 delivered +$19,053.35 across 11 trades and 2024 added +$14,117.63 across 20. The losses came in the transition years: -$4,802.00 in the 2022 bear, -$6,136.31 in the choppy 2025, and -$8,428.03 across just four trades in 2026. The worst trade, -$6,561.74, entered at $132.24 in December 2025 and exited at $105.58 in January 2026, when a sharp leg down took the line with it.
The fourth finding is a nuance worth keeping honest: the volatility-adjusted scores do not crown the strategy. Its Sharpe ratio of 0.58 sits slightly below buy and hold's 0.64. The gains came in return and drawdown, not in smoothness, because in exchange for skipping the worst of the declines, the strategy paid $2,717.37 in fees and repeatedly bought back in during failed recoveries.
What a Regression Trendline Is Good At
The mechanics explain the profile. A 100-day regression line lags by design; it confirms trends rather than calling them early. That is why the strategy caught the huge, sustained legs, late 2023 and late 2024, where the line carried the position for weeks, and why it bled in transitions, where price crossed the line repeatedly without commitment. The slope is the quiet advantage: a moving average tells you price is above or below its history, while the regression line tells you the direction of the fit itself, and this test confirms the line rarely flips to buy while the fit is still falling.
The practical read for a trend trader: the regression cross is not a new species of signal. It is a trend follower with a slightly better description of trend, and it behaves like one. It wins by surviving the downturns (69.12% drawdown instead of 96.27%) and participating in the big moves, and it loses by paying for failed re-entries whenever the market chops across the line.
The Practical Lesson
- The linear regression cross returned +138.64% on daily SOL over five years, ahead of buy and hold's +110.02%, with a 27-point shallower maximum drawdown
- The profile is textbook trend following: a 27.9% win rate carried by an average win more than three times the average loss, plus one outstanding trade of +$17,327.89
- The strategy gave back heavily in transitions: -$6,136.31 in 2025 and -$8,428.03 in 2026, proving the line does not protect against whipsaw
- Sharpe slightly trailed buy and hold (0.58 against 0.64), so the case for the cross rests on return and drawdown, not smoothness
The regression line is a real tool with a real edge on Solana's tape, and it comes with the oldest bill in trend following: many small losses for a few massive wins. Traders who can sit through a 28% win rate should find it interesting. Traders who cannot will find out why the exit is as important as the entry.
Run this linear regression backtest yourself and test your own trendline settings on CoinQuant. Backtest trend strategies free on CoinQuant
Disclaimer:
Key Takeaway
