
Price Action vs Indicators: Which Should a Crypto Trading Rule Be Built On?
Price action vs indicators is one of the oldest arguments in trading. Price action means reading the candles themselves: highs, lows, closes and the levels they leave behind. Indicators are formulas run over those same candles, such as moving averages, oscillators and bands.
This comparison sets price action vs technical indicators side by side on four criteria, without naming a winner up front. The question it answers is practical: which style can you turn into a rule that a backtest can check?
The short answer is both, as long as the idea is written down exactly. What cannot be tested is judgment that is never stated.
What We Compare and How
The same four criteria apply to both sides:
- What it sees: the raw candles, or a calculation from them.
- How fast it reacts: whether a signal waits on a formula's lookback.
- How much judgment it needs: whether two traders would read the same chart the same way.
- Whether it can be written as a rule: a condition exact enough for a backtest to check, candle by candle.
No backtest figures appear in this article. It compares the two styles as ways of building a rule, not as results.
What Price Action Means
Price action trading reads the candles directly. A daily candle gives four prices: the open, the high, the low and the close. Price action traders watch where closes land against earlier levels, such as a prior high. They also watch how the swings between highs and lows are shaped.
Swing points are the core of it. CoinQuant's Supported Elements page defines them plainly: "A swing high is a peak with lower highs on both sides; a swing low is a trough with higher lows on both sides." The same page notes that a "break of a key swing point (for example price closing below the last higher low) warns of a possible trend change."
Candlestick patterns are one kind of price action, but they are not the subject here. The focus is on levels and closes, because those are what a rule can state exactly.
What Indicators Are
An indicator is a formula over the same candles. Moving averages smooth the closes, oscillators such as RSI measure how stretched price is, and bands such as Keltner Channels wrap a range around an average. The Supported Elements page says CoinQuant "supports over 35 technical indicators, grouped into intuitive categories."
Every formula looks back over a set number of candles, so most indicators react after price has already moved. That lag is the cost of consistency: the same candles always give the same reading. For which indicators lag and which try to lead, see Leading vs Lagging Indicators: Which Should Your Crypto Strategy Use?
Price Action vs Indicators, Side by Side
| Criterion | Price action | Indicators |
|---|---|---|
| What it sees | The candles themselves: open, high, low, close and the levels they leave | A formula over those candles: an average, an oscillator or a band |
| How fast it reacts | No formula lag on the price itself, but a swing point is only confirmed a few candles later | Waits on the formula's lookback, so most signals come after the move has started |
| Judgment needed | High: two traders can mark different levels on the same chart | Low: the same candles give the same reading every time |
| Ease of testing | Testable once every level is defined exactly | Testable by default, because the formula is fixed |
| In CoinQuant | Price types (Close, Open, High, Low), Highest High (N), Lowest Low (N) and swing points as rule inputs | Over 35 indicators as rule inputs, next to the same price types |
| Verdict | Best for traders who can state their levels exactly | Best for traders who want a rule that reads the same every time |
The swing point lag is easy to miss. The Supported Elements page explains that "confirmation only happens after N bars form on the right side, so swings are marked with a short delay." Price action has no formula in the way, but a confirmed swing still arrives late.
Which Ideas Can Be Written as a Testable Rule
The test is simple: could two people turn your idea into the same yes or no on every candle? If they could, a backtest can check it. If they could not, the idea needs more words first.
| Idea | Testable as written? | Why |
|---|---|---|
| Buy when the daily close is above the highest high of the last 20 candles | Yes | Every term is defined: the close, the highest high and the 20 candles |
| Buy when the close breaks above the last swing high | Yes, once the swing is defined | A swing needs a lookback; CoinQuant's swing element uses 5 by default |
| Buy when RSI(14) crosses above 30 | Yes | The formula and the level are fixed |
| Buy when the chart looks heavy | No | Nothing in it can be checked on a candle |
| Sell when momentum feels exhausted | Not until it names a measure | Written as "RSI(14) crosses below 70", it becomes a different, testable rule |
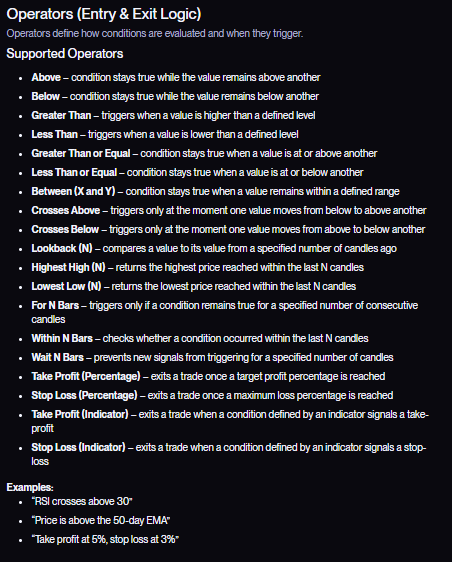
In CoinQuant, both styles use the same building blocks. The Supported Elements page lists the candle's own prices, such as the close, "last traded price of the candle", next to indicator conditions such as "RSI crosses above 30". It also lists operators such as Highest High (N), which "returns the highest price reached within the last N candles".
Where Each Side Is Better
Price action is better at context. A trader reading candles can see that a level has held several times, or that a breakout came on a quiet day, without waiting for a formula to catch up. The cost is judgment: the same chart can produce two different trades.
Indicators are better at consistency. A moving average cross fires on the same candle every time, which makes a rule easy to test, compare and repeat. The cost is lag, plus the temptation to stack indicators until the past fits. For how to add a second indicator without that trap, see How to Combine Multiple Indicators Without Overfitting Your Strategy.
Many rules mix the two. The swing points example on CoinQuant's Supported Elements page does exactly that: it buys Bitcoin when price breaks above the last swing high while price is above the 50 period EMA, with a stop below the last swing low.
How to Test Either Style
- Write the idea in plain English: name the price or indicator, the level and the action, for example "buy when the daily close crosses above the upper Keltner Channel band".
- Read the stored rule: check that the builder stored the condition you meant before you look at any result.
- Backtest over a fixed window: with fees included, on the coin and timeframe the idea is meant for.
- Compare it with holding the coin: same coin, same window, same fees.
Here is one stored rule that uses both styles at once. ETH Keltner 20-2 Breakout 1D 2021-2026 enters when the daily close crosses above the upper Keltner Channel band and exits when the close crosses back below the middle line. The close is pure price, and the band is an indicator that CoinQuant's documentation describes as "smooth volatility bands built from an EMA and ATR, often used for trend continuation and breakouts."
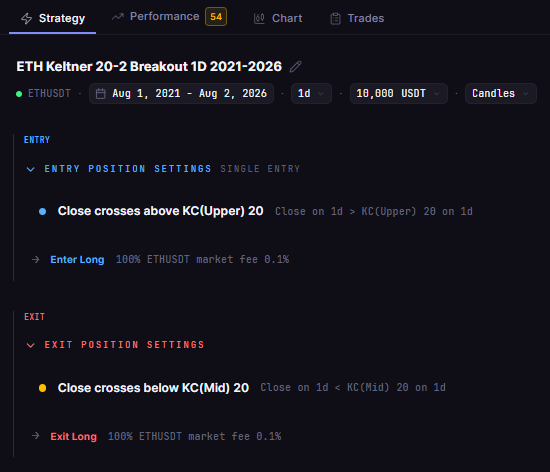
The rule is shown here only to show how a stored rule reads, not as a result. For a first rule to try, see a simple crypto trading strategy that actually works, backtested.
The Practical Lesson
- Price action: sees the candles directly, with no formula lag, but needs exact definitions before it can be tested.
- Indicators: read the same way every time and are easy to test, but they lag and invite overfitting.
- The deciding factor: whether the idea is written down exactly, not which style it comes from.
Pick the style you can write down: whichever you choose, a rule you can state exactly is a rule you can test before you trust it. In CoinQuant, an AI trading platform, you describe either kind of rule in plain English with no coding required, then read the stored rule before you run it.
Build trading strategies on real data. No coding required.
Frequently Asked Questions
Is price action better than indicators?
Neither is better in general. Price action sees the candles directly and needs judgment; indicators lag but read the same way every time. The better choice is the one you can write as an exact rule and test.
Can price action be backtested?
Yes, once each level is defined. "Close above the highest high of the last 20 candles" or a break of a confirmed swing high can be tested; "the chart looks heavy" cannot.
Should beginners start with indicators or price action?
An indicator rule is often the easier start, because it fires the same way every time and is simple to test. Price action can follow once you can name your levels exactly.
Write your price action or indicator idea as an exact rule and read it back before you trust it.
Disclaimer:
This content is for educational and informational purposes only and does not constitute financial, investment, or trading advice. All strategies and examples are for illustrative purposes and do not guarantee results. Always conduct your own research before making financial decisions.