
Keltner Channel vs Bollinger Bands: The Same Breakout Rule on Five Years of Ether (2021-2026)
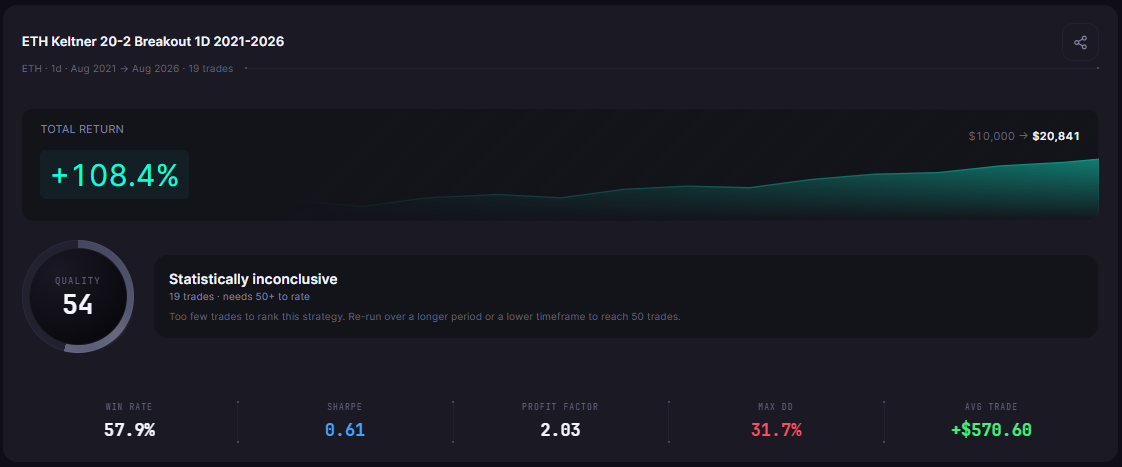
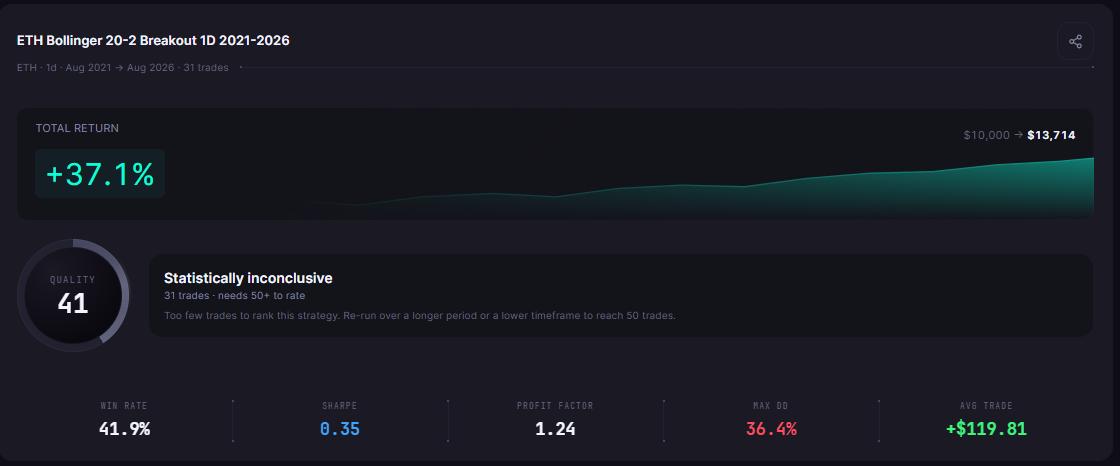
Keltner Channel vs Bollinger Bands is a common indicator question, because the two look almost the same on a chart. We ran the same breakout rule on Ether with each band, same window, same settings, on CoinQuant, an AI trading platform. The Keltner version returned 108.41% over 19 trades; the Bollinger version returned 37.14% over 31 trades. Holding Ether over the same five years lost 27.95%.
Both versions are small samples, under 50 trades each, so the cards mark both "Statistically inconclusive". The result describes this window; it does not prove that one band is better in general.
The author ran all three backtests on CoinQuant and reports the results without adjustment.
What We Compare and How
The test changes only one thing: the band. Everything else stays fixed, so any difference in the result comes from how each band is built.
We judge the two versions on four points, chosen before reading the results:
- Total Return: what $10,000 became.
- Max Drawdown: the deepest fall from a peak in equity.
- Profit Factor: gross profit divided by gross loss.
- Trade count and costs: how often each version traded and what it paid in fees.
Holding Ether for the whole window is the yardstick, so you can see whether either rule beat simply owning the coin.
Keltner Channel vs Bollinger Bands: How Each Band Is Built
Both indicators draw a middle line with a band above and below it. The difference between Keltner Channel and Bollinger Bands is the ruler each one uses to set the band's width.
| Feature | Keltner Channel | Bollinger Bands |
|---|---|---|
| Middle line | 20-day exponential moving average | 20-day simple moving average |
| Width measure | Average True Range (20), the average daily range including gaps | Standard deviation of the last 20 closes |
| Upper line in this test | Middle line plus 2 times ATR | Middle line plus 2 standard deviations |
| What drives the width | How far price travels within each day | How far closes spread around their average |
| Entry here | Close crosses above the upper line | Close crosses above the upper band |
| Exit here | Close crosses below the middle line | Close crosses below the middle band |
| Tested on | CoinQuant, ETHUSDT daily, same settings | CoinQuant, ETHUSDT daily, same settings |
| Verdict in this CoinQuant test | Higher return, fewer trades, smaller drawdown | Lower return, more trades, smaller worst trade |
In plain words, a Bollinger band widens when closes scatter and narrows when they bunch together. A Keltner channel follows the average size of each day's range, which tends to change more smoothly. For a fuller introduction, see what the Keltner Channel is and how traders use it.
The Rule and the Settings
The rule is the same for both bands:
- Entry: the daily close crosses above the upper line: enter long.
- Exit: the daily close crosses below the middle line: exit long.
If you searched for a Keltner channel breakout Ethereum result, this is it, side by side with its Bollinger twin.
| Parameter | Keltner version | Bollinger version |
|---|---|---|
| Strategy | ETH Keltner 20-2 Breakout 1D 2021-2026 | ETH Bollinger 20-2 Breakout 1D 2021-2026 |
| Band | Keltner Channel (20 EMA, 2 x ATR 20) | Bollinger Bands (20, 2) |
| Instrument | ETHUSDT (spot, Binance) | ETHUSDT (spot, Binance) |
| Data source | Kaiko via CoinQuant | Kaiko via CoinQuant |
| Timeframe and window | Daily, 2021-08-01 to 2026-08-01 | Daily, 2021-08-01 to 2026-08-01 |
| Capital and size | $10,000, 100% of equity | $10,000, 100% of equity |
| Direction | Long only, one position, no leverage | Long only, one position, no leverage |
| Fees | 0.1% on entry and exit (no slippage modelled) | 0.1% on entry and exit (no slippage modelled) |
Similar Bollinger and breakout ideas on Ether are tracked on the ETH Bollinger Bands strategy page and the ETH breakout strategy page.
Side by Side, With ETH Buy and Hold as the Yardstick
| Metric | Keltner version | Bollinger version | ETH Buy and Hold (same window) |
|---|---|---|---|
| Strategy | ETH Keltner 20-2 Breakout 1D 2021-2026 | ETH Bollinger 20-2 Breakout 1D 2021-2026 | ETH Buy and Hold 1D 2021-2026 |
| Total Return | 108.41% | 37.14% | -27.95% |
| Final Balance | $20,841.44 | $13,714.08 | $7,205.03 |
| Total Trades | 19 | 31 | 1 |
| Win Rate | 57.89% | 41.94% | n/a (single hold) |
| Profit Factor | 2.03 | 1.24 | n/a (single hold) |
| Sharpe Ratio | 0.61 | 0.35 | 0.26 |
| Max Drawdown | 31.74% | 36.44% | 79.30% |
| Time in Market | 22.28% | 26.77% | 100.00% |
| Total Fees | $613.60 | $765.45 | $17.20 |
All three runs share the same window, capital, sizing and 0.1% fee, so the rows compare like with like. Both band rules ended above $10,000 while holding Ether ended below it, and both kept their worst fall to less than half of holding's 79.30%.
The Keltner version leads on all four criteria: higher Total Return, higher Profit Factor (2.03 against 1.24), a smaller Max Drawdown (31.74% against 36.44%) and lower fees on fewer trades. Its card shows QUALITY 54 next to "Statistically inconclusive" (19 trades · needs 50+ to rate).
Why the Trade Counts Differ, and Why Both Are Small Samples
In this test, the close crossed above the Keltner upper line and opened a trade 19 times, against 31 times for the Bollinger upper band. A plausible reading is that the Bollinger band narrows in quiet stretches, so a modest move can poke above it, while the Keltner line follows the daily range and narrows less. This test does not prove that reason; it only shows the counts.
The extra trades cost the Bollinger version in two ways. It paid $765.45 in fees against $613.60, and fewer of its trades won: its Win Rate was 41.94% against 57.89%. It also spent more time in the market, 26.77% against 22.28%.
Neither count is large. Under 50 trades, one or two big winners can carry the whole result, so both cards say "Statistically inconclusive". The Bollinger card shows QUALITY 41 (31 trades · needs 50+ to rate). For why the count matters, see how many trades a backtest needs before you can trust it.
Where Each Band Is Better
So, Keltner Channels or Bollinger Bands? On this coin and window, the answer depends on what you value most.
| Point | Keltner version | Bollinger version | Better here |
|---|---|---|---|
| Total Return | 108.41% | 37.14% | Keltner |
| Max Drawdown | 31.74% | 36.44% | Keltner |
| Profit Factor | 2.03 | 1.24 | Keltner |
| Total Fees | $613.60 | $765.45 | Keltner |
| Worst single trade (after fees) | -$2,730.21 | -$1,608.61 | Bollinger |
| Average loss per losing trade (after fees) | $1,320.07 | $864.10 | Bollinger |
The Keltner version won on all four criteria set at the start. The Bollinger version's one clear strength is smaller losses per trade: its worst trade lost $1,608.61 after fees, against $2,730.21 for Keltner, and its average loser was smaller too.
Both deepest drawdowns came late in the window: from 13 August 2025 to 22 March 2026 for Keltner, and from 22 August 2025 to 8 April 2026 for Bollinger. A five-year result can still hide a long losing stretch near the end.
Other channel tests on the blog: the Keltner breakout on Bitcoin over nine years and Donchian vs Keltner breakouts on crypto.
What This Test Cannot Tell You
- One coin and one window: Ether, 2021 to 2026. Other coins or dates could reverse the order.
- One setting each: 20 periods and a multiplier of 2. Other settings were not tested.
- Costs: fees included at 0.1% per side; no slippage modelled.
- Structure: long only, one position, no leverage.
- Small samples: 19 and 31 trades describe what happened; they do not predict it.
For other approaches tested on the same coin, see five Ethereum trading strategies backtested.
The Practical Lesson
- Test lookalikes with the same rule: only the band changed here, and the return changed from 37.14% to 108.41%.
- Look past the return: the difference also showed in trade count, fees and drawdown.
- Confirm before choosing: under 50 trades each, so run a second test on another coin or window first.
In CoinQuant you can swap one indicator for another in the same rule and compare the two cards row by row.
Build trading strategies on real data. No coding required.
Frequently Asked Questions
What is the difference between Keltner Channels and Bollinger Bands?
Both draw bands around a 20-day average. Keltner sets the width from the average daily range (ATR) around an exponential average, while Bollinger uses the standard deviation of closes around a simple average.
Which is better for breakouts?
In this test on Ether from 2021 to 2026, the Keltner version returned 108.41% against 37.14% for Bollinger, with a smaller drawdown. Both are under 50 trades, so this is not proof in general.
Why did one version trade more often?
A close above the upper line opened 31 trades with the Bollinger version and 19 with the Keltner version. A band that narrows more in quiet periods is easier to cross, but this test only shows the counts.
Put two lookalike indicators through the same rule and see which one holds up.
Disclaimer:
This content is for educational and informational purposes only and does not constitute financial, investment, or trading advice. All strategies and examples are for illustrative purposes and do not guarantee results. Always conduct your own research before making financial decisions.