
Does Bitcoin Follow the Nasdaq? What 2026's Worst Stock Days Show
Lately, yes: in CoinQuant's check of daily closes, Bitcoin's daily moves over the 30 days to 5 Nov 2026 tracked the Nasdaq with a correlation of 0.78, and Bitcoin fell on each of the Nasdaq's five worst days of 2026. A Bitcoin trend rule in CoinQuant's library was in cash on two of those days and sold at the close of a third.
The Bitcoin correlation with Nasdaq stocks is not fixed, though. Over the full year to 5 November 2026, the same measure was 0.47, so the link in the 30 days to 5 November was tighter than over the year.
This article compares the two markets three ways: a correlation, the worst stock days and the trade log of one Bitcoin rule on those dates. Each view answers a different question.
Criteria First: How We Compare Two Markets
We used daily closes on the same dates. For each Nasdaq trading day, we took the Nasdaq Composite's daily % change and Bitcoin's daily % change on the same UTC day, close to close, from Binance BTCUSDT daily candles. Weekends drop out because the Nasdaq does not trade.
Then we measured three things:
- Correlation: the Pearson correlation of those daily % changes. A value of one means they always moved together; zero means no link.
- The worst days: the Nasdaq's five largest daily falls of 2026 and Bitcoin's move on each.
- One rule's position: what a Bitcoin trend rule held on each of those days, from its trade log on CoinQuant, an AI trading platform.
One timing detail matters. The Nasdaq closes at 16:00 New York time, and Binance's daily candle closes at 00:00 UTC, which is 19:00 or 20:00 in New York. That is a gap of three to four hours, so Bitcoin's daily close already includes a few hours of trading after the stock market shuts.
For a longer comparison of holding Bitcoin against a tech stock, see Bitcoin vs Apple: five years of buy and hold side by side.
The Answer First: Bitcoin Correlation With Nasdaq in 2026
Over the 30 days to 5 November 2026, the correlation was 0.78, measured on 22 shared trading days from 7 October. That is a strong link: on most days, when the Nasdaq fell, Bitcoin fell too.
Over the 365 days to 5 November 2026, the same method on 251 shared days gives 0.47. So Bitcoin and tech stocks moved together some of the time over the year, and much more in the last month. "Lately, yes" is the honest answer; "always" is not.
The Five Worst Nasdaq Days and What Bitcoin Did
| Nasdaq day (2026) | Nasdaq Composite daily change | Bitcoin daily change (UTC close to close) | Trend rule on that day |
|---|---|---|---|
| 5 Nov | -5.52% | -5.49% | After its test window |
| 5 Jun | -4.18% | -4.43% | In cash |
| 30 Oct | -2.86% | -0.80% | Held through the day, sold at the close |
| 22 Oct | -2.60% | -3.18% | Holding |
| 20 Jan | -2.39% | -4.54% | In cash |
Bitcoin fell on all five days. On three of them its fall was larger than the Nasdaq's, and on 30 October it barely moved.
The 5 November fall was the largest. The Nasdaq Composite closed at 24,315.00, down 5.52% and its biggest daily fall since 4 April 2025. Bitcoin's daily close that day was 76,088.01, down 5.49%.
Five out of five sounds decisive, but it is a small sample. It shows that on 2026's worst stock days Bitcoin did not act as a safe haven. It does not show that every bad stock day drags Bitcoin down.
Where a Bitcoin Trend Rule Was on Those Days
BTC RMA 50 Close Cross 1D Oct 2025-Nov 2026 buys when the daily close crosses above its 50-day RMA and sells when it crosses back below. It made nine trades from 6 October 2025 to 1 November 2026, so its card shows QUALITY 38 next to "Statistically inconclusive" (9 trades · needs 50+ to rate). We use its dates here, not its return.
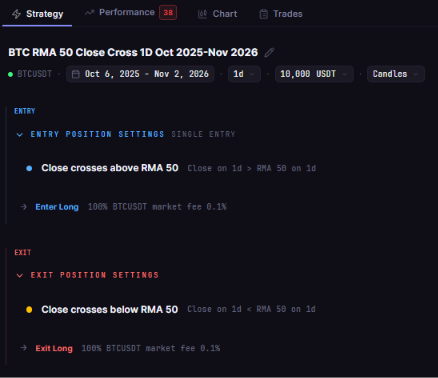
The stored rule of BTC RMA 50 Close Cross 1D Oct 2025-Nov 2026: enter long when the daily close crosses above the 50 period RMA, exit when it crosses back below.
On 20 January and 5 June the rule was in cash, so those falls never touched it. It held Bitcoin through 22 October, inside a trade it bought at the close of 19 August 2026.
It sold at the close of 30 October, so it still carried that day's small fall before stepping aside. The Trades tab shows a PNL % of 11.38% for that trade after fees. On 5 November its test window had already ended.
A row stamped 30 Oct 2026, 00:00 UTC was filled at the close of 30 Oct UTC. The last two rows of the log are both dated 1 November 2026: a buy at that close, and the test closing the position at the same price because the window ended there. They are not a finished trade.
For context, here is the rule next to holding Bitcoin over the same window, which started on the 6 October 2025 high.
| Metric | Trend rule | Holding Bitcoin |
|---|---|---|
| Strategy | BTC RMA 50 Close Cross 1D Oct 2025-Nov 2026 | BTC Buy and Hold 1D Oct 2025-Nov 2026 |
| Total Return | -5.00% | -37.27% |
| Final Balance | $9,500.37 | $6,273.06 |
| Total Trades | 9 | 1 |
| Max Drawdown | 14.59% | 53.02% |
| Time in Market | 28.83% | 99.74% |
| Card | QUALITY 38, "Statistically inconclusive" | QUALITY 11, "Statistically inconclusive" |
Both runs have fewer than 50 trades, so neither card rates them. BTC Buy and Hold 1D Oct 2025-Nov 2026, bought on 6 October 2025, ended at $6,273.06, below its starting balance. The platform's own Buy and Hold benchmark carries no fees, while BTC Buy and Hold 1D Oct 2025-Nov 2026 pays the 0.1% fee on entry and exit.
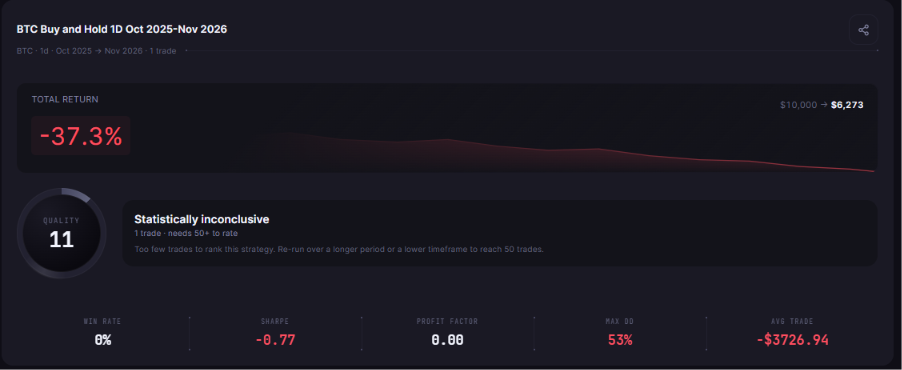
BTC Buy and Hold 1D Oct 2025-Nov 2026, tested from October 2025 to November 2026: one trade, -37.3%, $10,000 to $6,273 and QUALITY 11 next to "Statistically inconclusive".
Where Each View Is Better
| View | What it shows | What it misses |
|---|---|---|
| 30-day correlation | How often Bitcoin and the Nasdaq moved the same way lately | How big the moves were, why they happened, and anything older than a month |
| The worst stock days | What Bitcoin did on the days stocks were hit hardest | Five days is a small sample, and good stock days are left out |
| A Bitcoin rule's trade log | What the rule held on those exact dates | Stocks themselves: a rule that reads only Bitcoin prices cannot see them |
Correlation says how often the two markets moved together, not by how much or why. A crypto stock market correlation of 0.78 over one month can fade over the next, as the 0.47 over the year shows. For why one cycle or one window tells you little about the next, see whether you can trade Bitcoin's cycle.
A rule that reads only Bitcoin prices cannot see stocks. On 5 June it was already in cash for its own reasons, not because of the Nasdaq. Days like 5 November also hit harder with leverage; spot vs leveraged crypto trading shows how much.
Keep the limits in view: fees included (0.1% taker fee on entry and exit); no slippage modelled; long only, one position at a time, no leverage; past results do not predict future results.
The Practical Lesson
- Check the window of any correlation: 0.78 over 30 days and 0.47 over a year describe the same two markets.
- Look at the worst days, not only the average: Bitcoin fell on all five of the Nasdaq's worst days of 2026.
- Read your rule's trade log on those dates: when stocks lead, what your crypto rule held on those days matters more than its Total Return.
In CoinQuant you can open any backtest's Trades tab and find the dates that matter to you in seconds. Pick the five worst days of a market you watch and see where your rule was.
Build trading strategies on real data. No coding required.
Frequently Asked Questions
Does Bitcoin follow the Nasdaq?
Lately, often. Over the 30 days to 5 November 2026, the correlation of daily changes was 0.78, and Bitcoin fell on each of the Nasdaq's five worst days of 2026. Over the year to the same date it was 0.47.
Is Bitcoin correlated with stocks?
Partly, and it changes. A correlation of 0.47 over a year means they moved together some of the time; the 30-day figure was much higher. Neither says how big the moves were.
Why did Bitcoin fall with tech stocks on 5 Nov 2026?
The closes show that both fell, not why. The Nasdaq Composite fell 5.52% and Bitcoin's UTC daily close was 5.49% lower. This article does not analyse news, so it makes no claim about the cause.
Check where your own rule stood on the days that mattered.
Disclaimer:
This content is for educational and informational purposes only and does not constitute financial, investment, or trading advice. All strategies and examples are for illustrative purposes and do not guarantee results. Always conduct your own research before making financial decisions.