
Realistic Crypto Trading Returns: What 5 Backtested Strategies Actually Earned (2021-2026)
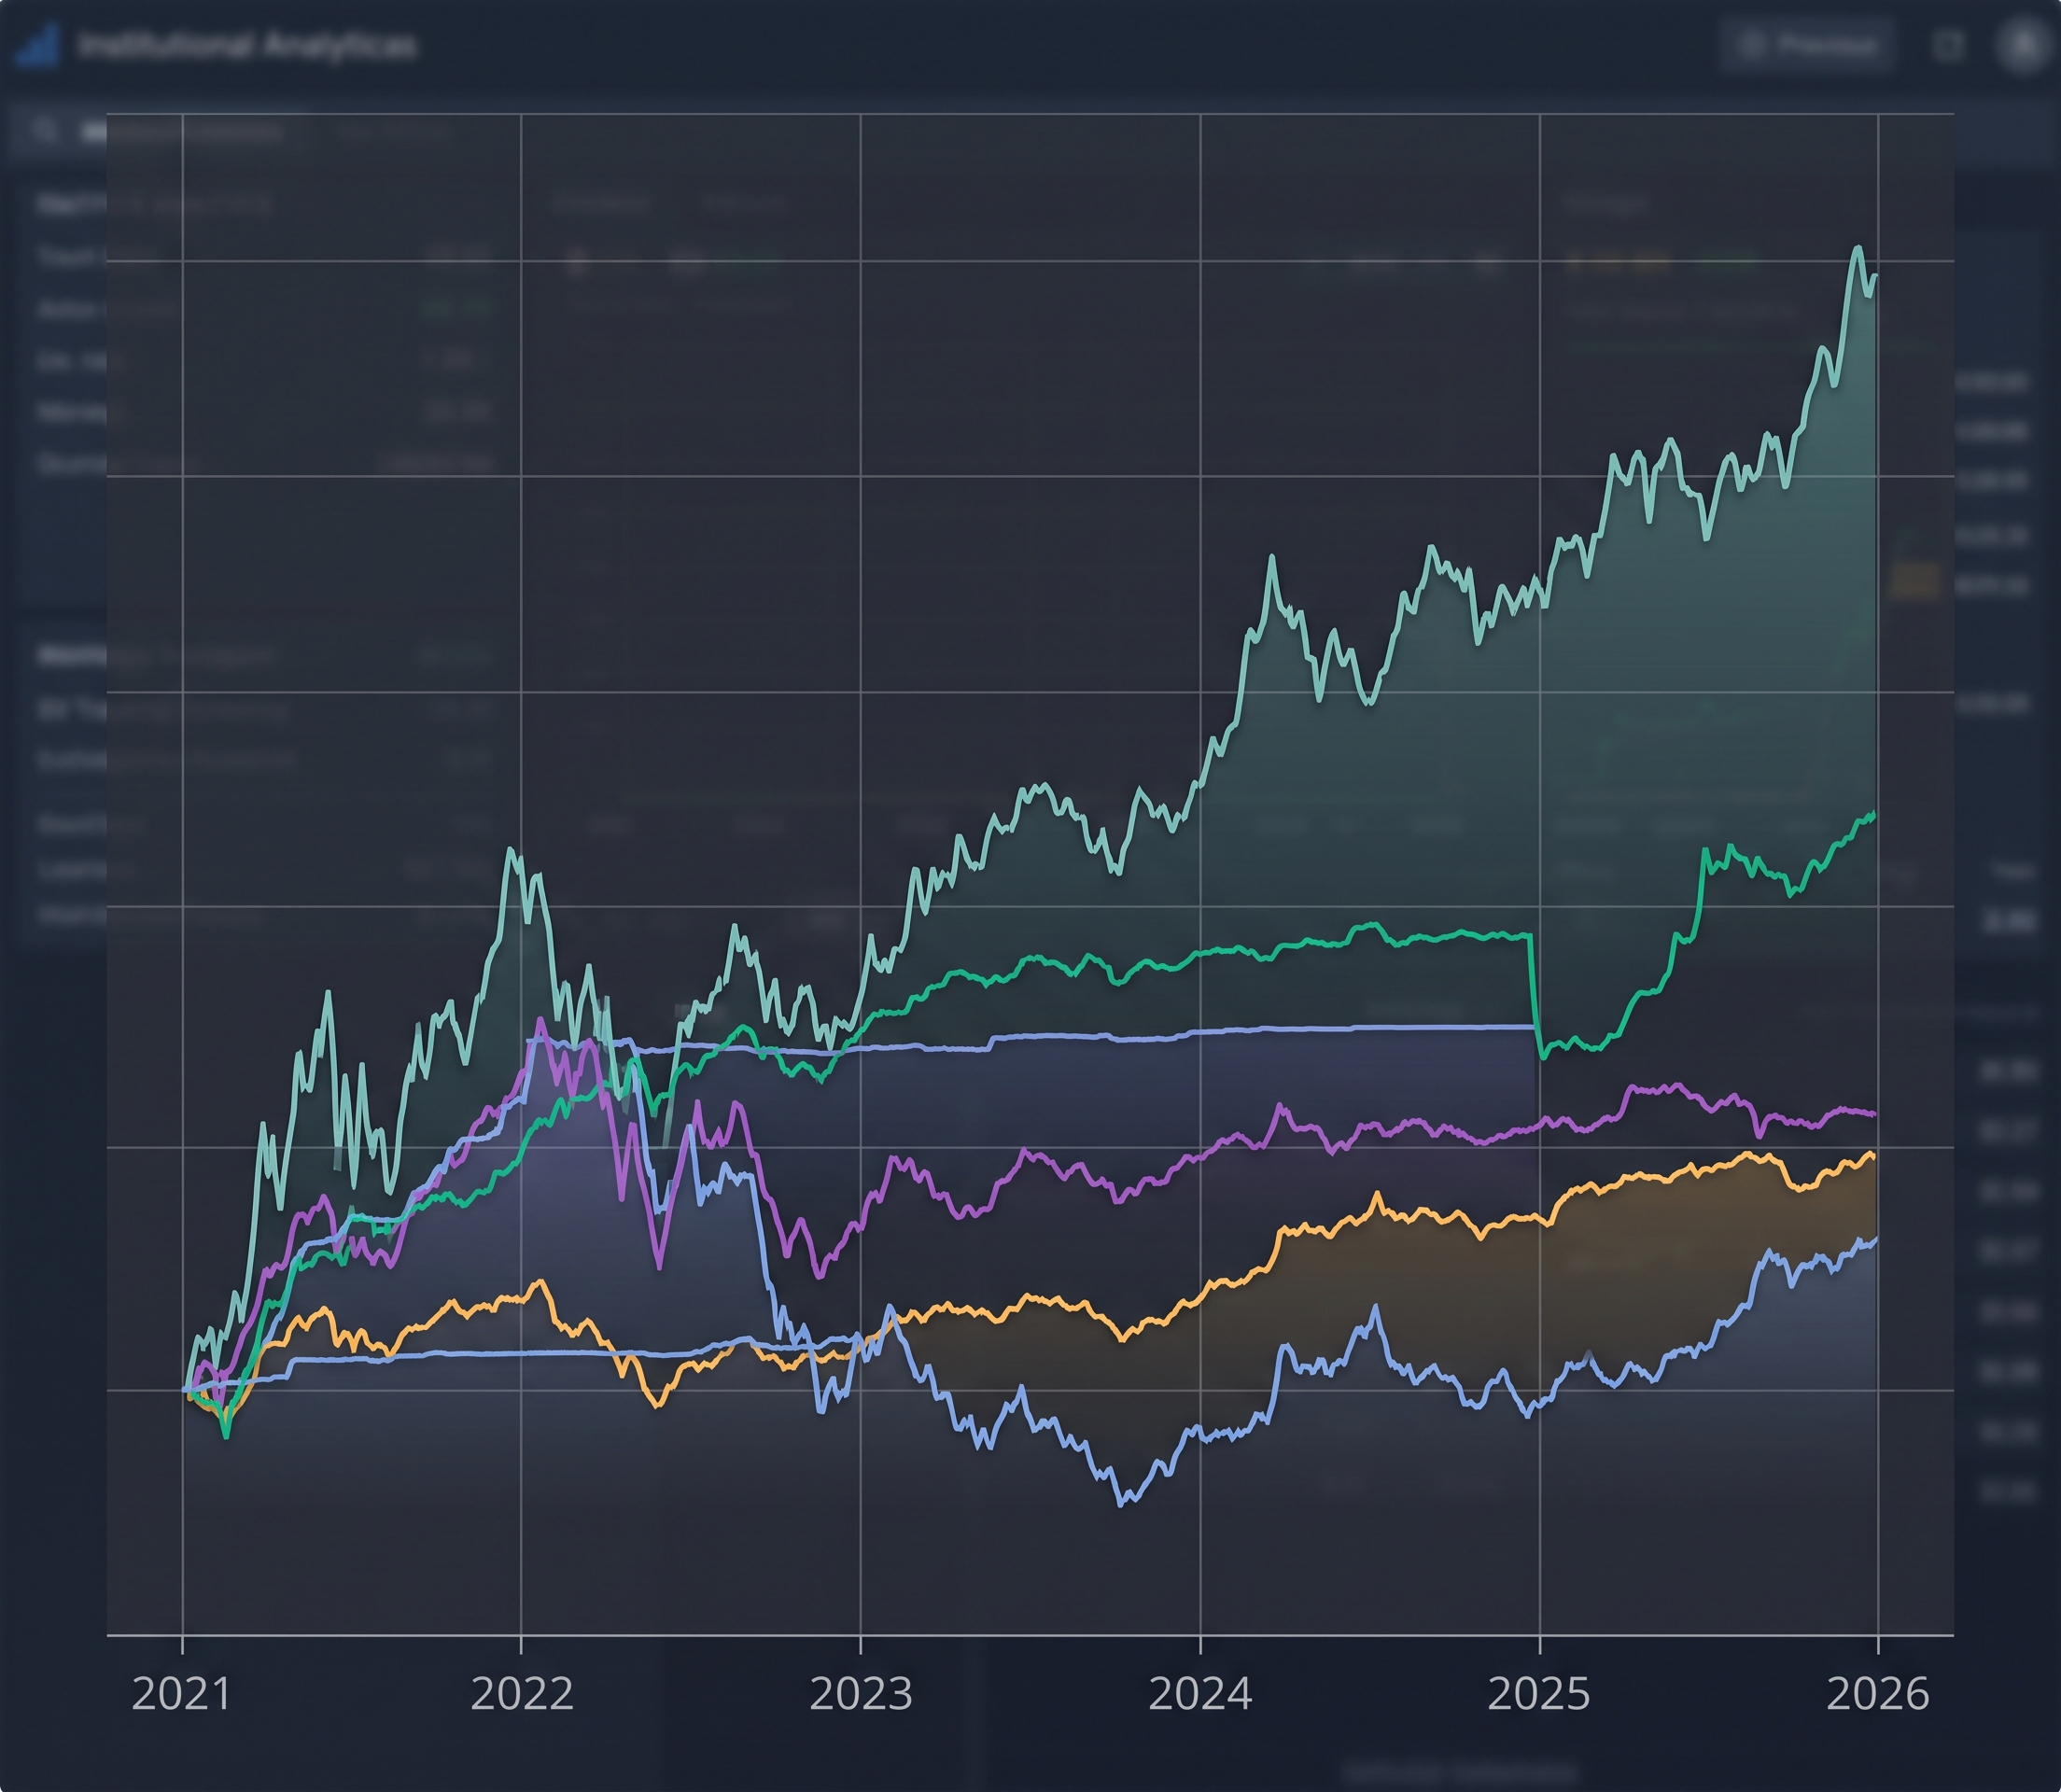
"How much can you make crypto trading?" is the most asked question in the industry and the least answered with data. The answers that circulate are either screenshots of one good month or promises from courses. The honest answer requires a full cycle and a set of strategies, not a highlight reel.
This article provides exactly that: five strategies from the CoinQuant strategy library, all backtested on daily Bitcoin over the same 5.6-year window, January 2021 to August 2026, with fees and slippage modeled on every trade. Every number is verified via the CoinQuant API.
The short answer to the title question: on a $10,000 account, these five strategies earned between +$1,036 and +$11,843 over 5.6 years, a range that includes the 2021 bull market, the 2022 crash, and the 2024 and 2025 rallies.
The Five Strategies
BTC Trend Following 1D 2021-2026: close crosses the 200-day SMA
BTC Mean Reversion 1D 2021-2026: RSI(14) crosses below 30, exits above 50
BTC EMA Crossover 20/50 1D 2021-2026: EMA 20 crosses EMA 50
BTC Bollinger Mean Reversion 1D 2021-2026: close crosses below the lower Bollinger band, exits at the middle band
BTC Breakout 1D 2021-2026: close breaks the 20-day high, exits on the 20-day low
All five are long only, no leverage, 100% position size, $10,000 starting capital, 0.1% taker fees modeled.
Test Setup
| Parameter | Setting |
|---|---|
| Strategies (library names) | The five BTC 1D family strategies above |
| Instrument | BTCUSDT (spot, Binance) |
| Timeframe | Daily (1D) |
| Tested window | 2021-01-01 to 2026-08-01 (5.6 years) |
| Direction | Long only, no leverage |
| Initial capital | $10,000 |
| Position size | 100% of equity per entry |
| Fees | 0.1% taker, modeled on every trade |
| Data source | Kaiko via CoinQuant |
The Results
| Strategy (library name) | Total Return | Final Balance | Trades | Win Rate | Profit Factor | Sharpe | Max DD |
|---|---|---|---|---|---|---|---|
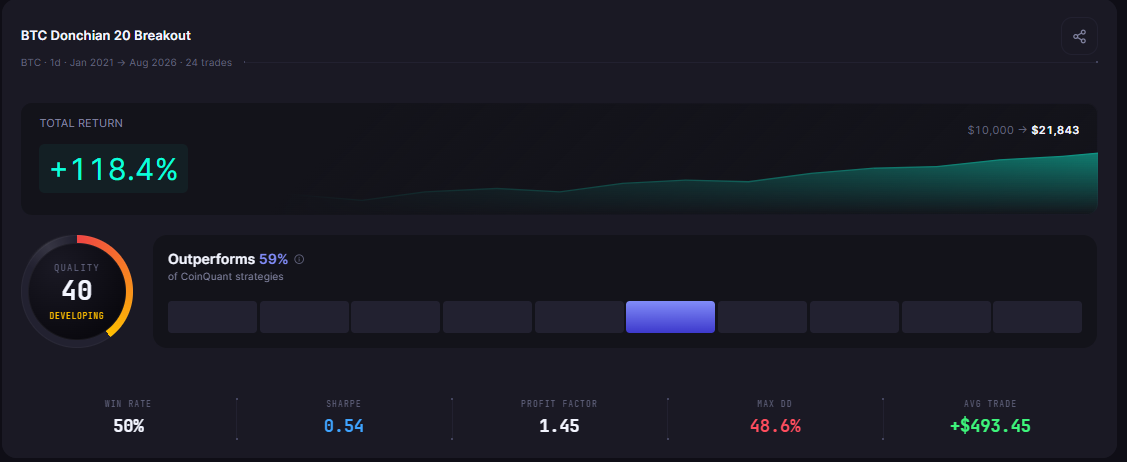
| BTC Breakout 1D 2021-2026 | +118.43% | $21,842.83 | 24 | 50.0% | 1.45 | 0.54 | 48.63% |
| BTC Trend Following 1D 2021-2026 | +82.80% | $18,279.53 | 25 | 20.0% | 2.02 | 0.49 | 37.63% |
| BTC EMA Crossover 20/50 1D 2021-2026 | +79.16% | $17,916.00 | 16 | 37.5% | 1.55 | 0.48 | 51.62% |
| BTC Mean Reversion 1D 2021-2026 | +39.29% | $13,929.03 | 14 | 57.1% | 2.12 | 0.35 | 24.63% |
| BTC Bollinger Mean Reversion 1D 2021-2026 | +10.36% | $11,036.17 | 35 | 65.7% | 1.07 | 0.22 | 52.67% |
What the Range Really Says
The five strategies earned between +10.36% and +118.43% total over 5.6 years, a period that contained a full bear market and two rally phases. On a $10,000 account, that is a range of $11,036 to $21,843.
Three observations matter more than the best number:
The average of the five is +66.01% total, about 9.4% annualized over the window, and the median strategy, EMA 20/50, earned +79.16%
The spread between best and worst is 108 percentage points, and the difference is strategy family, not luck. Breakout and trend rules caught the 2024 and 2025 rallies; the Bollinger mean reversion barely participated
Every strategy survived the 2022 bear market, and every strategy still carries a deep drawdown. The smallest max drawdown in the set is 24.63%, the largest is 52.67%
The Drawdown Reality
The return expectations discussion usually stops at the upside, and the drawdown column is why that is dangerous. The best strategy in the set, BTC Breakout, went through a 48.63% drawdown to earn its 118.43%. The EMA 20/50 strategy drew down 51.62%, more than half the account at its worst point.
The practical meaning: a trader who deployed the best strategy in this set still had to hold through a period where nearly half the account was underwater on paper. Most people who ask "how much can you make crypto trading" are not asking about a strategy that first loses half its value. That gap between the expected experience and the real one is where most strategies get abandoned, right before the recovery.
Year by Year: Where the Money Came From
The trades CSV exports of the verified backtests show the calendar-year pattern across the set:
| Year | Breakout | Trend Following | EMA 20/50 | Mean Reversion | Bollinger MR |
|---|---|---|---|---|---|
| 2021 | +$8,786 | -$3,763 | +$1,261 | -$1,057 | +$1,903 |
| 2022 | -$6,374 | $0 | -$4,389 | +$2,072 | -$4,706 |
| 2023 | +$1,958 | +$1,939 | +$1,353 | +$2,512 | +$3,266 |
| 2024 | +$5,626 | +$7,395 | +$5,220 | +$1,856 | +$1,704 |
| 2025 | +$3,118 | +$2,708 | +$6,210 | +$938 | +$2,093 |
| 2026 YTD | -$1,271 | $0 | -$1,739 | -$2,392 | -$3,224 |
Every strategy in the set lost money in at least one year, and three of the five lost money in 2022 (the trend follower sat in cash; the mean reversion made money). The profits came from the rally years, 2023 through 2025, which is the honest shape of crypto strategy returns: concentrated in trend periods, absent or negative in bear and range years.
Realistic Expectations
Putting the numbers together, the realistic frame for "how much can you make crypto trading" with a daily, no-leverage strategy family is:
A profitable, validated daily strategy on Bitcoin earned roughly +10% to +118% total over the 5.6-year cycle, before taxes
Drawdowns of 25% to 50% were normal even for the winners, and they came before the recoveries
Year-by-year returns were lumpy: losing years were common, and the multi-year result depended on holding through them
These are backtest results with fees and slippage modeled. Live results will be worse if execution is worse than the model
The Practical Lesson
The honest range is $11,036 to $21,843 from $10,000 over 5.6 years across five strategy families
Strategy family decides the outcome more than any other choice, a 108-point spread between best and worst
Drawdown is the hidden tax on every return in the table
No single year tells the story. The five-year table does, and that is the window a serious trader should use for expectations
Run these five strategies yourself and see the equity curves on your own screen. See realistic returns on CoinQuant
Disclaimer:
Key Takeaway