
Why Does My Backtested Crypto Strategy Fail Live? 6 Real Reasons

The pattern is always the same. The backtest looks great: a smooth equity curve, a win rate that impresses, a profit factor above 1.5. Then the strategy goes live, and within weeks the account is red, the signals feel late, and the equity curve looks nothing like the backtest.
Between a backtest and a live account, there is a gap filled with real-world costs that no chart displays. This article walks through the six reasons strategies fail live, each one illustrated with a real backtest from CoinQuant's strategy library, including the honest failures. Understanding these six gaps is what separates a trader who blames the market from one who fixes the strategy.
This article covers what happens after the test, when the strategy meets live conditions.
Reason 1: Fees Were Not Really Included
The most common live failure is the least glamorous: the strategy never accounted for the cost of trading itself.
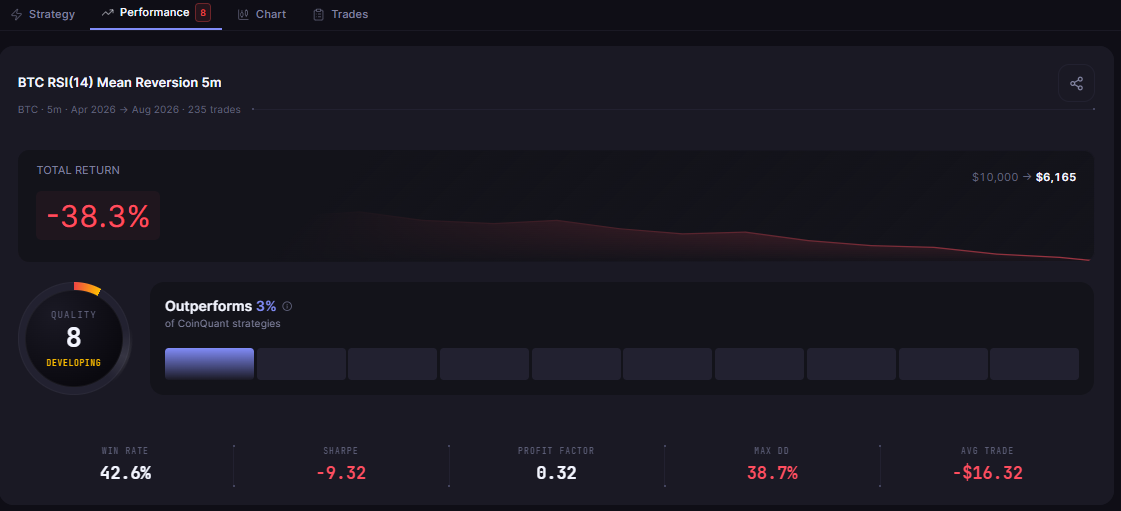
The difference is visible in one of CoinQuant's own library experiments. The identical RSI(14) mean reversion rule, buy below 30 and sell above 50, was backtested across six timeframes on Bitcoin. On the 5-minute chart it made 235 trades and paid $3,831 in fees while losing 38.3%. On the daily chart it made 13 trades, paid $364 in fees, and returned +55.8% with a profit factor of 3.04.
The rule is identical. The only difference is trade frequency, and the fee column explains most of the gap. A backtest that models 0.1% taker fees on every trade (the Binance standard built into CoinQuant runs) will show this. A backtest that ignores or halves fees will show a phantom edge that live trading immediately eats.
Reason 2: Slippage Was Assumed Away
Fees are predictable; slippage is not. In a backtest, the fill happens at the signal price. Live, the fill happens at whatever price the market offers when the order arrives, and on fast-moving crypto the difference can be larger than the fee.
The same mean reversion rule tested on the 1-hour chart lost 33.0% over 72 trades with a profit factor of 0.52. Even with perfect fills the strategy was losing, and every basis point of slippage widened the hole. The practical rule: if a strategy's edge is smaller than the combined cost of fees plus expected slippage, it will fail live no matter how the backtest looks. Stress-test any borderline result by adding a few basis points of slippage per trade and re-running.
Reason 3: The Regime Changed After the Test
A backtest is a sample of history, and history has regimes: trending months, ranging months, crash months. A strategy tuned on one regime inherits that regime's personality.
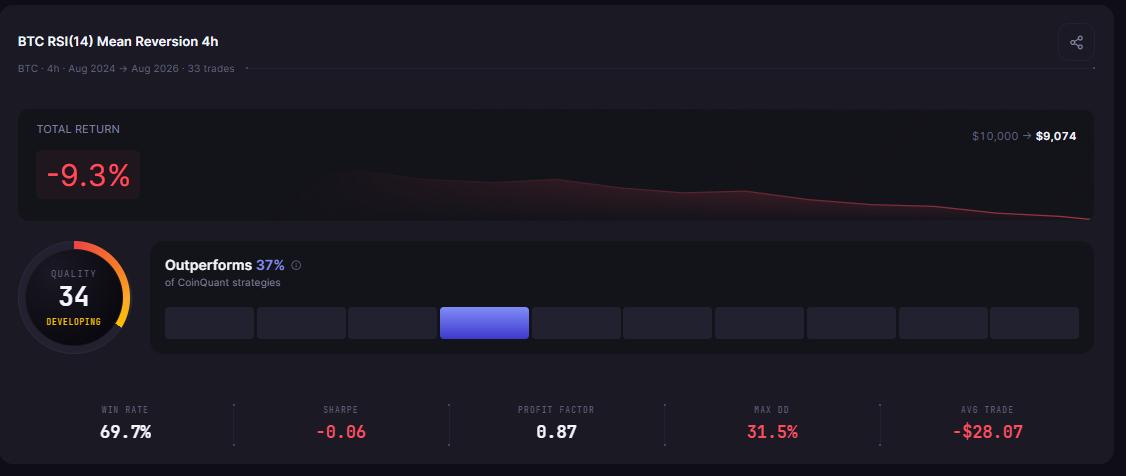
CoinQuant's library holds a clean demonstration. The BTC RSI(14) Mean Reversion rule on the 4-hour chart won 69.7% of its 33 trades yet still lost 9.3%, because the wins were small and the drawdowns deep. That is a strategy whose edge depends on the market staying range-bound. The moment Bitcoin trends, every oversold reading is followed by a more oversold reading, and the same rule that looked cautious in a range becomes a falling-knife catcher.
The defense is not to avoid regime shifts, it is to test across them. A window that includes at least one bull phase, one bear phase, and one sideways phase, which is why CoinQuant's Kaiko data going back to 2017 for Bitcoin matters, will show whether the edge survives the regimes it will meet live.
Reason 4: The Strategy Was Overfit to Its Own Test
This is the most common cause of live failure that is not about markets at all: the strategy was tuned until the backtest looked good, and the tuning was actually memorization.
When a trader tries twenty parameter combinations and keeps the best one, the backtest of that survivor is no longer a prediction, it is a record of a search. The live market was not part of the search, so it does not cooperate. The practical warning here is that any strategy whose parameters were chosen because they produced a good chart needs an out-of-sample test before it goes live.
CoinQuant's walk-forward analysis exists for exactly this reason: run the strategy on one window, then re-run it unchanged on the next window, and compare the results. If the out-of-sample window decays sharply, the edge was in the tuning, not the rules.
Reason 5: The Strategy Depends on Too Few Trades
A profitable backtest built on five trades is a story, not evidence. Small samples make results fragile in both directions: a lucky five trades can produce a gorgeous curve, and the live market simply does not repeat the luck.
The library's ETH RSI Mean Reversion 1D 2021-2026 strategy made only 10 trades over five years and lost 57.2%, with a profit factor of 0.25. But the reverse case is the trap: a version of a strategy that wins on three of four trades looks unbeatable in the report and is statistically meaningless. As a rule of thumb, a strategy needs at least 30 to 50 trades in the test window before its win rate and profit factor deserve any trust, and the Quality Score on every CoinQuant backtest already flags small-sample results as low-confidence.
Reason 6: The Strategy Outruns Its Capital
Position sizing and drawdown tolerance are part of the strategy, whether they are written down or not. A backtest with a 40% max drawdown is a mathematical statement; live, it is a psychological and financial event that most traders cannot survive.
The VWAP Intraday Reversion BTC strategy backtested on Bitcoin 1h lost 32.90% over 15 months with a 38.27% max drawdown on a $10,000 account, meaning the account was underwater by nearly $4,000 at its worst point. A trader who starts with $10,000 and cannot watch the account sit at $6,200 will abandon the strategy at exactly the wrong moment, converting a bad backtest into a realized loss, or worse, will double the position to "get it back" and accelerate the drawdown.
The fix is to size for the worst case before going live: assume the backtest drawdown will happen again, and set position size so that drawdown is survivable.
How to Close the Gap Before Going Live
None of these six failures is exotic, and all six are visible before a single dollar goes live if the workflow includes them:
Confirm the fee model matches your exchange (0.1% taker on Binance, as CoinQuant models by default)
Add a slippage assumption to every borderline result
Test across multiple regimes, not one favorable window
Keep an out-of-sample window untouched until the final test (walk-forward analysis automates this on CoinQuant)
Demand at least 30 to 50 trades before trusting the metrics
Size positions so the backtest's max drawdown is survivable
The Bottom Line
A backtest answers one question: would this strategy have made money on this data with these costs? Live trading asks a different question: can this strategy survive fees, slippage, regime shifts, its own tuning, its sample size, and its drawdown, simultaneously?
The six failure modes in this article are the gap between those two questions. Every one of them is testable before going live, and every one of them was demonstrated here with real library backtests, including the negative results, because a strategy that fails honestly in the test is a strategy that did its job: it failed before it could hurt you.
Disclaimer:
Key Takeaway
