
Time-Series Momentum on Solana: Does Holding Only When 90-Day Momentum Is Positive Work? (2021-2026)

Time-series momentum crypto strategies hold a coin only while its own recent return is positive. We tested the simplest version on Solana: buy when the 90-day Rate of Change crosses above zero, sell when it crosses back below. From August 2021 to August 2026 it returned 267.71% after fees, against 110.02% for buying and holding SOL.
The win came with real pain. Only 28.89% of its 45 trades were winners, and the Max Drawdown still reached 80.82%. One trade returned 451.73% after fees and earned more than the whole net profit, so the other 44 trades lost money in total.
This test uses one plain-English rule, one coin and one fixed five-year window on Kaiko data via CoinQuant, with fees on every fill. It reports the results without adjustment: no tuned parameters, no cherry-picked dates.
What a Time-Series Momentum Crypto Strategy Does
Time-series momentum, also called absolute momentum, compares an asset with its own past. If the price is higher than it was a set number of days ago, you hold. If it is lower, you step aside. It does not rank coins against each other; that is cross-sectional momentum, a different strategy type covered in our guide to every type of crypto trading strategy.
The Rate of Change (ROC) indicator measures exactly this. ROC(90) is the percentage change between today's close and the close 90 daily bars ago, so it sits above zero whenever SOL is higher than three months earlier.
- ROC crosses above 0: the 90-day return turns positive, a sign a trend may be starting.
- ROC crosses below 0: the 90-day return turns negative, the cue to step aside.
Used this way, a 90 day momentum strategy works as a trend following momentum filter: it decides when to own the coin, not which coin to own. If you are new to the idea of rule-based strategies, start with what a crypto trading strategy is.
The Exact Rules We Tested
The strategy was written as one plain-English prompt in CoinQuant with no coding required. It was stored with the rules below.
| Parameter | Setting |
|---|---|
| Strategy | SOL ROC(90) Momentum 1D 2021-2026 |
| Instrument | SOLUSDT (spot, Binance) |
| Data source | Kaiko via CoinQuant |
| Timeframe | Daily (1D) |
| Tested window | 2021-08-01 to 2026-08-01 |
| First trade to last exit | 2021-08-11 to 2026-07-06 |
| Rate of Change settings | Period 90, source Close |
| Entry | RateOfChange(period=90, source=Close) crosses above 0 on 1d timeframe, enter long, market order |
| Exit | RateOfChange(period=90, source=Close) crosses below 0 on 1d timeframe, exit long, market order |
| Direction | Long only, no leverage, one position at a time |
| Initial capital | $10,000 |
| Position size | 100% of equity per entry |
| Fees | 0.1% taker on entry and 0.1% on exit (no slippage set) |
| Baselines (same window) | SOL Buy and Hold 1D 2021-2026; BTC Buy and Hold 1D 2021-2026 |
Both conditions are crosses, so each fires only on the day ROC changes side. The rules panel shows the pair exactly as stored.

SOL ROC(90) Momentum 1D 2021-2026 in the CoinQuant builder: enter when the 90-day Rate of Change crosses above zero, exit when it crosses below, on daily SOLUSDT.
Results vs SOL Buy and Hold
The momentum rule finished at $36,771.35 from $10,000. Holding SOL for the same five years finished at $21,002.12, and holding Bitcoin at $15,733.43.
| Metric | ROC(90) momentum | SOL buy and hold | BTC Spot Comparison |
|---|---|---|---|
| Strategy | SOL ROC(90) Momentum 1D 2021-2026 | SOL Buy and Hold 1D 2021-2026 | BTC Buy and Hold 1D 2021-2026 |
| Total Return | 267.71% | 110.02% | 57.33% |
| Final Balance | $36,771.35 | $21,002.12 | $15,733.43 |
| Total Trades | 45 | 1 | 1 |
| Win Rate | 28.89% (13W / 32L) | n/a (single hold) | n/a (single hold) |
| Profit Factor | 1.38 | n/a | n/a |
| Sharpe Ratio | 0.72 | 0.64 | 0.44 |
| Sortino Ratio | 1.17 | 0.97 | 0.63 |
| Max Drawdown | 80.82% | 96.27% | 76.63% |
| CAGR | 29.73% | 15.99% | 9.48% |
| Time in Market | 48.44% | 100.00% | 100.00% |
| Total Fees | $3,040.04 | $31.01 | $25.74 |
All three runs share the same window, capital, sizing and 0.1% fee, so the rows compare like with like. The rule was in the market 48.44% of the time, yet it beat holding SOL on Total Return, Sharpe Ratio and Max Drawdown.
Against the BTC spot comparison the return gap is wider still: holding Bitcoin returned 57.33%. Bitcoin's Max Drawdown of 76.63% was shallower than the momentum rule's, though. In this test the filter cut SOL's drawdown, but it did not make SOL calmer than Bitcoin.
In the app's equity chart for this run, the Buy and Hold line for the same 2021-08-01 to 2026-08-01 window ends at 110.44%, slightly above the 110.02% in the table. The line carries no fees, while the SOL Buy and Hold 1D 2021-2026 strategy pays the fee on its entry and exit. The results card below shows the strategy's own numbers.
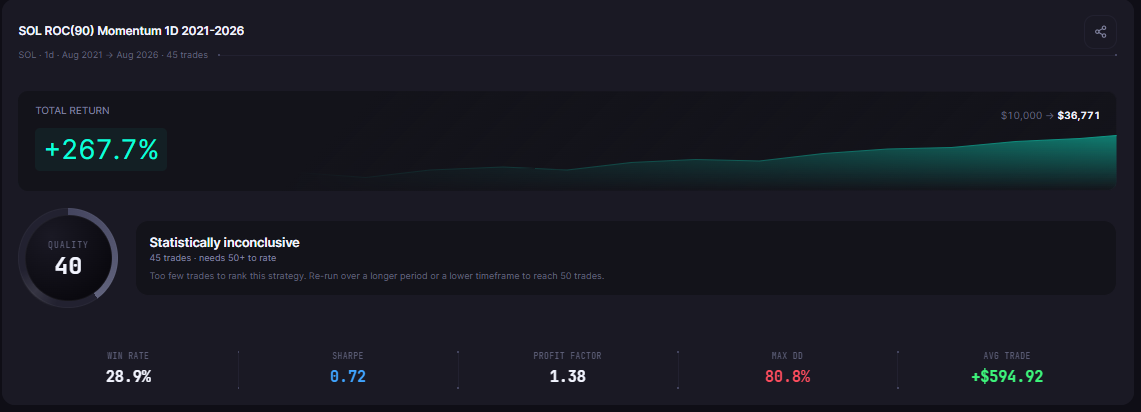
SOL ROC(90) Momentum 1D 2021-2026 on SOLUSDT, 2021-08-01 to 2026-08-01: Total Return 267.71%, Max Drawdown 80.82%, Profit Factor 1.38, Win Rate 28.89% and Sharpe Ratio 0.72 across 45 trades, with $10,000 growing to $36,771.35.
Why a 28.89% Win Rate Still Made Money
Thirteen trades won and 32 lost. The strategy still made money because the winners were far larger: the average winning trade returned 58.43% after fees, while the average losing trade lost 6.40%. That imbalance is what a Profit Factor of 1.38 captures.
One Trade Carried the Result
The best trade ran from 2023-10-20 to 2024-06-11 and returned 451.73% after fees (a 452.39% price move), adding 50,148.95 USDT. That is 187.32% of the strategy's total net profit. The first big trend, from 2021-08-15 to 2021-12-07, returned 254.84% after fees.
Winners were also held far longer: about 42 daily bars on average, against about 11 for losers. The best trade stayed open for 235 bars.
Everything else was a grind. The median trade lost 2.20%, and the longest losing streak ran to 10 trades in a row. In 2022, as SOL fell, the rule opened only five trades and none lasted more than a week, which is the filter doing its job.
What the Fees Cost
Forty-five round trips at 0.1% per fill cost $3,040.04 in Total Fees, against $31.01 for holding. Every false start pays the fee twice. The rule also exits only after momentum has already turned, so it gives back part of each rally before it steps aside.
What This Test Cannot Tell You
This is one coin, one rule and one boom-and-bust cycle. SOL's price rose 452.39% during the best trade alone, and that single trend supplied more than the entire profit. A different coin or start date could easily produce the opposite verdict.
- Severe drawdown: an 80.82% Max Drawdown is still a crash most traders would not sit through.
- Concentration: with one trade at 187.32% of net profit, the result depends on catching that one trend.
- Costs: fees were modelled at 0.1% per fill, but slippage was not modelled, so real fills could be worse.
- One setting: only period 90 was tested; nearby periods were not compared.
- Small sample: 45 trades is below the 50 that CoinQuant's Quality score needs to rate a strategy, so the results card marks this run "Statistically inconclusive".
- Long only: the rule sits in cash while momentum is negative and never shorts, so it cannot profit from a fall.
- Data: Kaiko data via CoinQuant for Binance spot SOLUSDT, with no daily bars missing in this window.
For a shorter ROC cross on another coin, see our Rate of Change strategy backtest on Ethereum, a different class of rule. Past results do not predict future returns.
The Practical Lesson
- It beat holding: 267.71% against 110.02% for SOL buy and hold, with a smaller Max Drawdown (80.82% against 96.27%).
- It still hurt: a 28.89% Win Rate and an 80.82% drawdown are hard to live with.
- Know where the money came from: one trade made 187.32% of the net profit.
- Fees add up: 45 trades cost $3,040.04 in fees, against $31.01 for holding.
A momentum filter can beat holding in total and still hurt on the way. The next step is to run the same rule on other coins and windows in CoinQuant, an AI trading platform that tests strategies across thousands of assets, before you trust it with money.
Build trading strategies on real data. No coding required.
Frequently Asked Questions
Does time-series momentum work in crypto?
On Solana from August 2021 to August 2026, a 90-day momentum rule returned 267.71% after fees, against 110.02% for buy and hold. It is one coin and one window, and most of the profit came from a single trend, so treat it as evidence to test further, not proof.
What is a 90-day momentum strategy?
It holds an asset only while the price is above where it was 90 days earlier. Here that meant entering when ROC(90) crossed above zero and exiting when it crossed below.
Is a momentum strategy better than holding Solana?
In this test it returned more with a smaller Max Drawdown (80.82% against 96.27%), but it won only 28.89% of its trades and paid $3,040.04 in fees. Whether it suits you depends on whether you can follow a rule through long losing streaks.
Test the 90-day momentum filter on your own coin and window.
Disclaimer:
Key Takeaway