
Supertrend 7,3 vs 10,3: Which Setting Held Up on Five Years of BNB? (2021-2026)
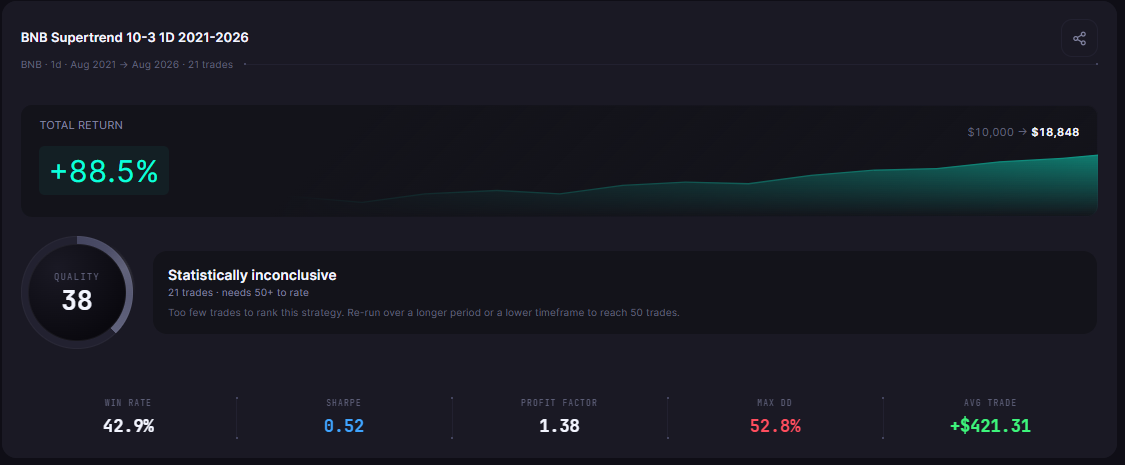
Supertrend 7,3 vs 10,3 is a common question for traders who use the indicator on the daily chart. On five years of BNB, tested on CoinQuant, the 10,3 setting turned $10,000 into $18,847.56, a Total Return of 88.48% over 21 trades. The faster 7,3 setting returned 53.36% over 19 trades, and simply holding BNB returned 72.58%.
So 10,3 beat both holding and 7,3, while 7,3 trailed holding. Both settings fell less than holding at their worst: a Max Drawdown of 52.84% for 10,3 and 50.75% for 7,3, against 69.85% for BNB. Both runs have fewer than 50 trades.
The author ran every backtest in this article on CoinQuant, with the same window, capital and 0.1% fee. This article reports the results without adjustment. No tuned parameters, no cherry picked dates.
What Supertrend Is and What 10,3 and 7,3 Mean
CoinQuant's Supported Elements page defines it in two sentences: "Supertrend measures trend direction using price and volatility. It is built on the Average True Range (ATR), which captures how much an asset typically moves." The line sits below price in an uptrend and flips above it when the close crosses it.
The same page names the two inputs that matter: "The ATR period and a multiplier are the key tunable inputs." That is what the two numbers in a setting mean:
- First number (ATR period): how many daily bars the ATR averages.
- Second number (multiplier): how many ATRs away from the bar's midpoint the line sits.
So what is Supertrend 10,3? It is Supertrend with a 10 day ATR and a multiplier of 3. The 7,3 setting keeps the multiplier and shortens the ATR to seven days.
For the same indicator on other coins, see Supertrend on Ethereum: 6 Years of Backtest Results and Supertrend on Solana: 3 Years of Backtest Data Across Bull, Bear, and Chop.
The Rule and the Settings
Both strategies use the same rule, and only the ATR period changes. Each buys BNB when the daily close crosses above the Supertrend line and sells when it crosses below. There is no stop or target.
| Parameter | Setting |
|---|---|
| Strategy | BNB Supertrend 10-3 1D 2021-2026; BNB Supertrend 7-3 1D 2021-2026 |
| Entry | Close crosses above Supertrend (ATR period 10 or 7, multiplier 3) |
| Exit | Close crosses below Supertrend (same setting as the entry) |
| Instrument | BNBUSDT (spot, Binance) |
| Data source | Kaiko via CoinQuant |
| Timeframe | Daily (1D) |
| Tested window | 2021-08-01 to 2026-08-01 |
| Direction | Long only, no leverage, one position at a time |
| Initial capital | $10,000 |
| Position size | 100% of equity per entry |
| Fees | 0.1% on entry and 0.1% on exit (fees included, no slippage modelled) |
| Baselines (same window) | BNB Buy and Hold 1D 2021-2026; BTC Buy and Hold 1D 2021-2026 |
Because everything else is fixed, any gap between the two results comes from the ATR period alone, on this coin and this window.
Supertrend 7,3 vs 10,3: Buy and Hold Comparison
The table sets both settings against holding BNB and, as a BTC Spot Comparison, against holding Bitcoin over the same five years.
| Metric | 10,3 setting | 7,3 setting | BNB Buy and Hold | BTC Spot Comparison |
|---|---|---|---|---|
| Strategy | BNB Supertrend 10-3 1D 2021-2026 | BNB Supertrend 7-3 1D 2021-2026 | BNB Buy and Hold 1D 2021-2026 | BTC Buy and Hold 1D 2021-2026 |
| Total Return | 88.48% | 53.36% | 72.58% | 57.33% |
| Final Balance | $18,847.56 | $15,336.02 | $17,257.91 | $15,733.43 |
| Total Trades | 21 | 19 | 1 | 1 |
| Win Rate | 42.86% (9W / 12L) | 31.58% (6W / 13L) | n/a (single hold) | n/a (single hold) |
| Profit Factor | 1.38 | 1.25 | n/a (single hold) | n/a (single hold) |
| Sharpe Ratio | 0.52 | 0.41 | 0.48 | 0.44 |
| Max Drawdown | 52.84% | 50.75% | 69.85% | 76.63% |
| CAGR | 13.51% | 8.92% | 11.52% | 9.48% |
| Total Fees | $848.08 | $604.49 | $27.27 | $25.74 |
All four runs share the window, capital, sizing and 0.1% fee on entry and exit. CAGR is the steady yearly rate that turns $10,000 into the same final balance over the five years. A Profit Factor of 1.38 means the 10,3 rule's winning trades made $1.38 for every $1 its losing trades lost, after fees.
The 10,3 setting finished 15.90 percentage points of Total Return ahead of holding BNB and had the best Sharpe Ratio of the four runs. The 7,3 setting trailed holding BNB and also trailed holding Bitcoin.
On the Performance tab, the results card of the 10,3 run shows its QUALITY number, 38, next to "Statistically inconclusive" (21 trades · needs 50+ to rate).
The Faster Setting Made Fewer Trades Here
You might expect the faster setting to trade more. On this BNB window it traded less: 19 trades against 21. Its first trade came on 1 October 2021, against 4 August 2021 for 10,3.
The two trade logs show where the counts split. Most trades cover the same moves, with dates within seven days of each other. Four stretches differ (dates UTC, results after fees):
| Period | 10,3 setting | 7,3 setting |
|---|---|---|
| Aug to Sep 2021 | One trade, a gain | No trade |
| Nov to Dec 2022 | No trade | One trade, a loss |
| Oct 2023 to Jun 2024 | Two trades: a small loss, then its best trade (+$20,769.22) | One trade, its best (+$17,085.72) |
| Jul to Sep 2025 | Two trades, both gains | One trade, a gain |
The logs show what happened, not why. A different coin or window could reverse the pattern, so treat "faster means more trades" as something to test, not assume.
Both best trades rode the same 2023 to 2024 rally and sold on 10 June 2024 at 625.1. The 7,3 run bought earlier and lower, at 228.5 against 254.6, yet made less in dollars because it entered with a smaller balance.
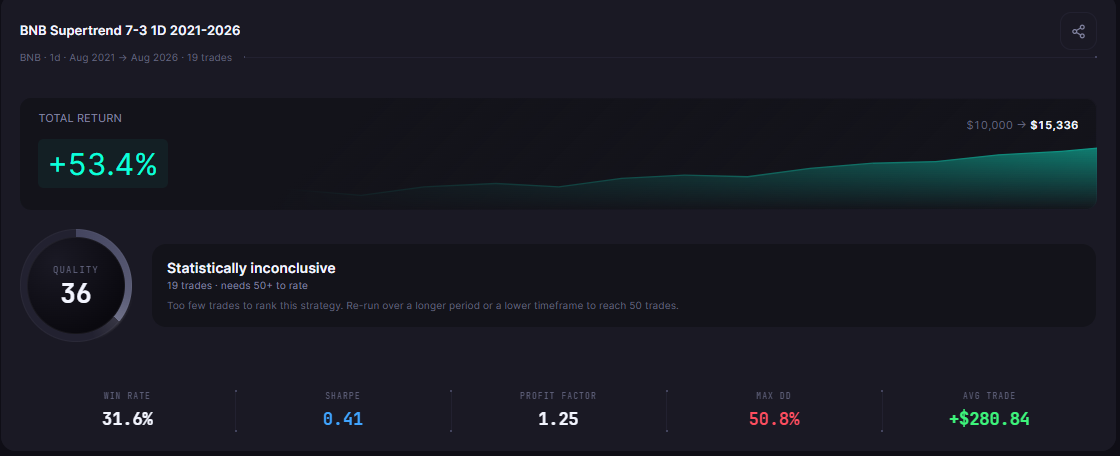
The 7,3 run paid less in Total Fees, $604.49 against $848.08: every fill pays 0.1% of its size, and it made fewer fills on a smaller balance. It spent slightly more of the window in the market (Time in Market 46.85% against 45.32%), so its trades lasted longer on average. Its results card shows 19 trades and a QUALITY of 36, next to "Statistically inconclusive".
Why You Should Not Pick a Setting From One Backtest
Two settings, one coin and one window make a narrow test. Both cards mark their runs "Statistically inconclusive", with QUALITY numbers of 38 and 36.
- One trade did most of the work: the 10,3 run's best trade made $20,769.22, more than its whole net gain of $8,847.56. Its other 20 trades together lost money after fees.
- The same holds for 7,3: its best trade made $17,085.72 against a net gain of $5,336.02.
- Both gave back about half: both balances peaked on 6 June 2024, at $39,962.83 for 10,3 and $30,704.93 for 7,3. The 10,3 run ended the window at its lowest point since that peak.
A winner that rests on one rally can change places with a small shift in dates. If you are choosing Supertrend settings for swing trading on a daily chart, test each setting on more than one coin and more than one window. For how much data that takes, see How Much Historical Data Do You Need for a Reliable Crypto Backtest?
What This Test Cannot Tell You
A different multiplier, coin or period could rank the two settings the other way.
- Costs: fees included, no slippage modelled. Each trade pays 0.1% on entry and 0.1% on exit.
- Direction: long only, one position, no leverage. Neither rule shorts the falls it sits out.
- Window: 2021-08-01 to 2026-08-01, past data only. Both runs closed their last trade on 3 June 2026, and the test says nothing about any later period.
- Rule design: Supertrend alone, with no filter. Pairing it with a second indicator is a different test, as RSI + Supertrend on Bitcoin: Can Combining Two Indicators Beat Either Alone? (Backtest) shows.
Past results do not predict future results.
The Practical Lesson
- 10,3 came first here: 88.48% Total Return, against 72.58% for holding BNB and 53.36% for 7,3.
- The faster setting traded less: 19 trades against 21, with a later first trade.
- Both cut the worst fall: 52.84% and 50.75% Max Drawdown, against 69.85% for holding BNB.
Settings change results in ways you cannot guess in advance. In CoinQuant, an AI trading platform, you can write a Supertrend rule in plain English with no coding required, then run it again with a second setting. Test the settings you plan to use, and check that the winner holds on another window.
Build trading strategies on real data. No coding required.
Frequently Asked Questions
What is Supertrend 10,3?
It is Supertrend with a 10 day ATR period and a multiplier of 3. In this CoinQuant backtest, a close cross rule with that setting returned 88.48% on BNB from 2021-08-01 to 2026-08-01 across 21 trades, with fees included.
Is 7,3 or 10,3 better for daily charts?
On five years of daily BNB, 10,3 did better: 88.48% against 53.36%, and only 10,3 beat holding BNB. Both runs have fewer than 50 trades and are "Statistically inconclusive", so test Supertrend settings for the daily chart on your own coin before choosing.
What are good Supertrend settings for swing trading?
No single setting wins everywhere. Pick two or three settings, test each on the coin and timeframe you trade, with fees included, and keep the one that also holds up on a second window.
Test both Supertrend settings on your own coin and window, with fees included.
Disclaimer:
Key Takeaway